Chapter 12: Intrusion Detection and Prevention Systems#
“An alarm that goes off every time the wind blows is not a security system.” security aphorism
Learning Objectives#
After completing this chapter, you will be able to:
Distinguish intrusion detection from intrusion prevention and network-based from host-based.
Explain signature-based, anomaly-based, and stateful-protocol analysis detection methods.
Describe false positives, false negatives, and the precision/recall trade-off.
Explain how Snort rules are structured and write a basic rule.
Describe Security Information and Event Management (SIEM) and its role.
Explain User and Entity Behavior Analytics (UEBA) and how it detects insider threats.
Describe threat hunting and how it differs from reactive alerting.
Interpret a detection alert and begin a triage workflow.
Key Terms#
IDS: Intrusion Detection System; monitors and alerts on suspicious activity.
IPS: Intrusion Prevention System; actively blocks suspicious traffic in line.
NIDS: network-based intrusion detection system; monitors network traffic.
HIDS: host-based intrusion detection system; monitors a single host’s activity.
Signature: a pattern matched against known attack traffic or behavior.
Anomaly detection: flagging deviations from a baseline of normal behavior.
False positive (FP): an alert fired on benign activity.
False negative (FN): a real attack that does not trigger an alert.
Precision: TP / (TP + FP); fraction of alerts that are real attacks.
Recall: TP / (TP + FN); fraction of real attacks that trigger an alert.
SIEM: Security Information and Event Management; aggregates and correlates log data.
SOAR: Security Orchestration, Automation, and Response.
UEBA: User and Entity Behavior Analytics.
Threat hunting: proactive search for adversary activity not caught by automated alerting.
12.1 Detection System Types#
An intrusion detection system is a smoke alarm and an intrusion prevention system is a sprinkler. The alarm reports and leaves the judgment to a person, which is cheap when it is wrong and useless when nobody is listening. The sprinkler acts on its own, which is what you want during a real fire and expensive when the sensor misreads steam from a kettle, because a false positive on a prevention system is an outage you caused yourself. A sprinkler has one action, though, and a prevention system has many, from dropping a single connection to isolating a host, so the real decision is per rule rather than per product. Many deployments run the same engine in both modes, with confident rules blocking and uncertain ones alerting.
Network-Based IDS and IPS#
NIDS sensors are placed at strategic network points: the internet perimeter, between zones, and at internal aggregation points. They receive a copy of network traffic from a switched port analyzer (SPAN) port or a network tap, and inspect it against rules. An IPS is placed inline and can drop or reset traffic that matches rules, at the cost of adding latency and creating a potential failure point. Many organizations deploy IDS out-of-band and use the firewall or next-generation firewall (NGFW) for actual blocking.
Placement Considerations#
NIDS inside the firewall sees decrypted traffic on the internal network but misses encrypted external traffic. NIDS outside the firewall sees all inbound traffic but cannot inspect encrypted payloads. TLS inspection at the firewall or proxy allows the IDS to see decrypted traffic without sitting outside the firewall, at the cost of certificate management complexity.
Host-Based IDS#
HIDS monitors local system activity: file system changes (integrity monitoring), process creation, registry modifications, login events, and system calls. Examples include OSSEC, Wazuh, and commercial endpoint detection and response (EDR) tools. HIDS is not affected by network-level encryption because it observes behavior on the host after decryption.
Intrusion Detection Systems: What They Watch#
Having framed detection conceptually, we can be precise about what an intrusion detection system (IDS) is and does. An IDS detects actions and events that attempt to compromise the confidentiality, integrity, or availability of assets and resources. It is fundamentally a passive device: it monitors and alerts, but does not block. Detection can run in real time or out-of-band, and an IDS is only as good as its input, so operators must know what to look for; most systems are signature-based, while anomaly-based systems can catch oddities in transactions that no signature anticipated.
IDS deployments fall into three categories. A network-based IDS (NIDS) inspects traffic on the wire and may be hardware or software, sometimes built into bastion hosts as application-level or multilayer firewalls; monitoring requires the sensor to see traffic via an inline placement, a SPAN/mirror port, or a network tap, and the most common open-source NIDS is Snort. A host-based IDS (HIDS) lives as an application on an endpoint and examines the whole system, watching security events, normal communications, system behavior, and software integrity; common HIDS tools include OSSEC, Tripwire, and AIDE (the Advanced Intrusion Detection Environment). Finally, physically-based detection (security guards, store gates, cameras, alarms) also monitors and alerts and can double as a deterrent, a reminder that detection is not only digital.
Intrusion Prevention Systems: From Alert to Action#
An IDS tells you something is wrong; the natural next step is to stop it, which is the job of an intrusion prevention system (IPS). An IPS performs the same detection of CIA-threatening actions and then takes action based on the signatures, acting as an active gatekeeper that monitors, alerts, and blocks. To block, it must operate in real time and inline in the traffic path, which makes IPS trickier to deploy than IDS: because traffic flows through it, if the system fails, traffic stops flowing (a fail-closed trade-off that must be planned for).
Like detection, prevention comes in network, host, and physical forms. A network-based intrusion prevention system (NIPS) is usually hardware (large networks favor dedicated appliances) placed inline for maximum effect; some software can send out-of-band TCP resets to tear down connections, but that is uncommon. A host-based intrusion prevention system (HIPS) lives as an application and can monitor nearly every aspect of a system, and it is often sandboxed or virtualized so that analyzing hostile code does not infect the host. Physically-based prevention is anything that physically stops harm (an electric fence is the textbook, if impractical, example). The defining difference from an IDS is the verb: detection observes, prevention intervenes.
        flowchart LR
    T[Traffic] --> S{Sensor}
    S -->|IDS: passive, copy via SPAN/tap| A[Alert only]
    T --> I{IPS: inline}
    I -->|matches signature/behavior| B[Block / drop / reset]
    I -->|clean| F[Forward]
    A -.-> SIEM[SIEM / analyst]
    B -.-> SIEM
12.2 Detection Methods#
Two of the methods below are worth meeting together, because their errors are opposites. Signature detection is a doorman holding a photograph and anomaly detection is a doorman watching for odd behavior. The photograph is precise and blind: it almost never accuses the wrong person, and it will never recognize anyone whose picture nobody has taken, which is the whole of the zero-day problem in one sentence. The instinct generalizes and is noisy: it can catch someone entirely new, and it will also stop the nervous man who is merely late. Choosing between them is choosing which error you would rather absorb, and running both is normal. The picture says nothing about where a sense of normal comes from, and that is the sharpest limitation of anomaly detection: it learns normal from what it observed during training, so an intrusion already underway while the baseline was being built becomes part of the definition of normal and is never reported.
Signature-Based Detection#
Signature detection matches traffic or behavior against a database of known attack patterns. Snort, Suricata, and Zeek support signature-based detection. Advantages: low false-positive rate for known attacks, deterministic, and auditable. Limitations: zero-day attacks have no signature; attackers can modify payloads to evade known signatures; high maintenance burden as signatures must be continuously updated.
Snort Rule Anatomy#
A Snort rule has two parts: the rule header and the rule body.
alert tcp any any -> 192.168.1.0/24 80 (msg:"GET /etc/passwd"; content:"/etc/passwd"; sid:1000001; rev:1;)
alert: action (alert, log, drop, reject).tcp: protocol.any any: source IP and port.->: direction.192.168.1.0/24 80: destination network and port.msg: human-readable alert message.content: byte pattern to match in payload.sid: unique rule identifier.rev: revision number.
Anomaly-Based Detection#
Anomaly detection establishes a baseline of normal behavior and alerts on deviations. A user who logs in from a new country, accesses 10× their normal volume of files, or connects at 3 AM when they never have before triggers an anomaly alert. Machine learning models (isolation forest, autoencoders) are used for complex baseline modeling.
The Precision/Recall Trade-Off#
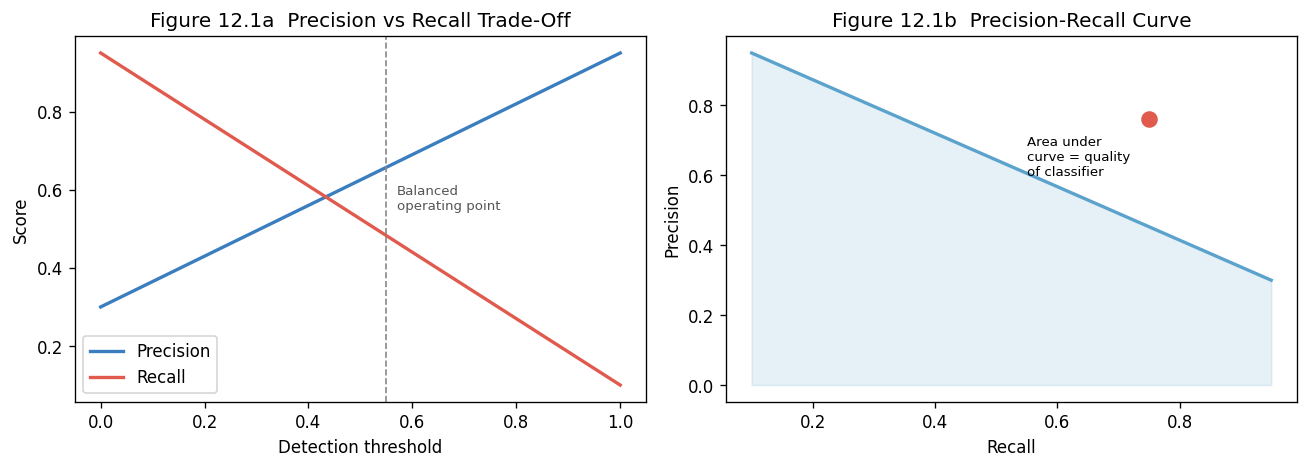
Anomaly detection suffers from high false-positive rates because legitimate behavior is variable. Tightening the anomaly threshold reduces false positives but increases false negatives. A low- sensitivity model misses real attacks (high FN rate); a high-sensitivity model alerts on benign activity constantly (high FP rate). Effective tuning requires labeled historical data and business context about what is truly abnormal. Section 17.7 works through the statistics behind such thresholds: a rule that alerts three standard deviations above the mean raises about 13 false alarms a day across 10,000 hosts checked once a day, even when the data are perfectly normal, and counts and losses usually call for the Poisson and heavy-tailed distributions rather than the bell curve.
Stateful Protocol Analysis#
Stateful protocol analysis enforces expected protocol behavior at the state-machine level. An HTTP parser flags requests that deviate from RFC 7230, such as oversized headers or unusual method verbs, even if no signature matches. This catches protocol exploitation and evasion techniques that modify known payloads to avoid content matching.
Detection Methods: Signature, Heuristic, and Anomaly#
Whether a tool detects or prevents, and whether it guards the network, the host, or a file, it relies on one or more detection methods, and understanding their trade-offs explains why defense-in-depth layers several of them. The same three methods underpin IDS, IPS, antivirus, traffic analysis, and application security alike.
Signature-based detection matches content against known patterns: byte sequences, file types, ports, protocols, and hashes. Its advantages are that signatures are updated frequently (sometimes several times a day), can be written for IDS/IPS/applications, can point to a whole family of malicious content, and produce few false positives. Its weaknesses are that signatures can be evaded, zero-day threats have no signature (false negatives), update deployment can lag, and the more you check for, the more data you must match.
Heuristic (behavior-based) detection looks at what content does: file changes, network traffic, and the same characteristics a signature might use. It is usually faster (it need not consult every signature), focuses on behavior, can be harder to evade because malware tends to follow behavioral patterns, and may avoid scanning a file at all. Its downsides are that it yields generic rather than detailed verdicts, can still be evaded, and tends to raise both false positives and false negatives.
Other methods push further into anomaly detection: building a baseline from historical traffic patterns and statistical models of how information is normally accessed, then flagging deviations, increasingly with machine learning (the techniques developed in Chapter 17, including the author’s encrypted log-anomaly work). No single method suffices, which is exactly why mature defenses combine signatures for known threats, heuristics for variants, and anomaly/ML for the genuinely novel.
Signature-based |
Heuristic / behavior |
Anomaly / ML |
|
|---|---|---|---|
Detects |
known patterns |
suspicious behavior |
deviation from baseline |
Zero-days |
misses (FN) |
may catch |
may catch |
False positives |
few |
more |
tunable, often more |
Output |
specific (family) |
generic |
statistical |
Knowledge Check
State the one-word difference in what an IDS does versus an IPS, and the deployment consequence of that difference.
Why does signature-based detection struggle with zero-day threats, and which method compensates?
Why must an IPS typically be deployed inline while an IDS can sit on a SPAN port?
Answers: (1) An IDS alerts (passive) while an IPS blocks (active); because the IPS sits inline, its failure can stop traffic (fail-closed), so it needs careful availability planning. (2) A zero-day has no existing signature, producing false negatives; heuristic/behavioral and anomaly/ML detection can flag it by behavior or deviation. (3) To block traffic an IPS must be in the actual path; an IDS only needs a copy of the traffic, which a SPAN port or tap provides.
12.3 SIEM and Log Aggregation#
A shop with cameras and nobody at the monitors has logging without monitoring. The recording is genuine and it helps only after the fact, during the investigation, which is worth something and is not detection. Monitoring is the watching: a person, or a rule that raises something a person will actually see. The common failure is not the absence of logs but their abundance, an alert volume so high that the desk is effectively empty even though somebody is sitting at it. Camera footage is also complete, while logs are selective, capturing what somebody decided in advance to record. Discovering during an incident that the relevant events were never logged has no equivalent in a picture where the camera simply sees the room.
SIEM Architecture#
A SIEM collects logs from every source in the environment: firewalls, endpoints, servers, applications, cloud APIs, network devices, and authentication systems. It normalizes them into a common schema, stores them long-term, and correlates events across sources to detect complex attack chains that no single source could identify.
Detection Use Cases#
A SIEM correlation rule firing on: failed login to account A, successful login to account A 5 minutes later from a different IP, followed by file access to a sensitive share, followed by data transfer to an external IP captures the Mitre ATT&CK pattern for credential stuffing, initial access, and exfiltration. No individual event is alarming; the sequence is.
SIEM Challenges#
A SIEM that receives 100,000 events per second and generates 10,000 alerts per day has an alert-fatigue problem. Analysts who cannot process the alert volume begin to ignore alerts. Effective SIEM operation requires: tuned correlation rules that reduce noise, prioritization by asset criticality, automated enrichment (IP reputation, known-bad hashes), and analyst workflows that handle the highest-priority alerts first.
SIEM, SOAR, XDR, and EDR: The Detection Stack#
Modern detection is delivered through a stack of overlapping platforms whose acronyms confuse newcomers, so it helps to place each precisely. A SIEM (Security Information and Event Management) aggregates logs and events from across the enterprise, normalizes them, and correlates them to raise alerts and support investigation and compliance (Chapters 3 and 19); it is the analyst’s single pane of glass but generates many alerts. SOAR (Security Orchestration, Automation, and Response) sits on top to automate repetitive response with playbooks, enriching alerts, opening tickets, and quarantining hosts without human delay, addressing the alert-fatigue problem SIEM creates. EDR (Endpoint Detection and Response) instruments endpoints directly to detect and respond to malicious behavior on the host (Chapter 15), recording process trees and enabling remote isolation. NDR (Network Detection and Response) does the analogous job for network traffic (Chapter 11). XDR (Extended Detection and Response) unifies endpoint, network, identity, email, and cloud telemetry into one correlated detection-and-response layer, the convergence of the others.
Platform |
Scope |
Primary job |
|---|---|---|
SIEM |
All log sources |
Aggregate, correlate, alert, retain |
SOAR |
Response workflow |
Automate and orchestrate response (playbooks) |
EDR |
Endpoints |
Detect and respond on the host |
NDR |
Network |
Detect and respond on traffic |
XDR |
Cross-layer |
Unified correlation and response across all of the above |
These feed the security operations center (SOC), where tiered analysts triage alerts; the architecture’s goal is to shorten mean time to detect (MTTD) and mean time to respond (MTTR), the metrics by which a detection program is judged.
12.4 UEBA and Threat Hunting#
User and Entity Behavior Analytics#
UEBA applies statistical models to user, host, and network entity behavior over time. It detects: accounts exhibiting credential-stuffing patterns, service accounts behaving like user accounts, hosts communicating with unusual peers, and data access volumes that deviate from historical baselines. UEBA is particularly effective against insider threats and compromised accounts whose credentials are valid but whose behavior is abnormal.
Threat Hunting#
Threat hunting is the proactive, hypothesis-driven search for adversary activity that has not triggered automated alerts. A hunt starts with a hypothesis (e.g., “assume an attacker has compromised a service account and is using it for lateral movement”) and searches for evidence that confirms or disproves it. Hunters use raw log data, threat intelligence, and knowledge of adversary tactics, techniques, and procedures (TTPs) rather than relying on pre-written correlation rules.
Hunt Methodology#
Develop a hypothesis based on threat intelligence, recent incident data, or MITRE ATT&CK.
Define the data sources that would contain evidence if the hypothesis is true.
Query those data sources for the expected indicators.
Analyze results, adjusting the query iteratively.
Document the hunt, its findings, and any detection gaps identified.
Cyber Kill Chain / MITRE ATT&CK: models of attacker stages and of tactics/techniques used to organize detection.
SIEM / SOAR / EDR / NDR / XDR: the detection-and-response platform stack.
Detection engineering / threat hunting: writing and tuning detections; proactively hunting evaded adversaries.
MTTD / MTTR: mean time to detect / respond, the key SOC metrics.
Detection Engineering, Threat Hunting, and Deception#
Tools are only as good as the detections loaded into them, which is the discipline of detection engineering: writing, testing, and tuning rules, increasingly as version-controlled detection-as-code. Rules are expressed in formats such as Snort/Suricata signatures for network traffic, YARA for file content, and Sigma, a vendor-neutral language that compiles to many SIEMs. A simple Sigma-style rule reads:
# Sigma-style detection: many failed logins then a success (possible brute force)
title: Possible Successful Brute Force
logsource: { product: windows, service: security }
detection:
  failures:  { EventID: 4625 }      # failed logon
  success:   { EventID: 4624 }      # successful logon
  timeframe: 5m
  condition: failures | count() > 20 followed by success
level: high
Every rule lives on the precision-versus-recall curve of Chapter 12’s detection methods: too loose and analysts drown in false positives, too tight and real attacks slip through, so tuning is continuous. Beyond automated rules, threat hunting is the proactive, hypothesis-driven search for adversaries who evaded detection: a hunter starts from an ATT&CK technique or a hypothesis (“an attacker would use WMI for lateral movement”), queries the telemetry, and either finds evil or turns the finding into a new detection. Hunting prioritizes durable TTPs over brittle indicators of compromise (IOCs), climbing the “pyramid of pain.” Finally, the deception of Chapter 11 (honeypots, honeytokens) feeds high-confidence alerts straight into this stack.
Knowledge Check
Why does detecting an intrusion earlier in the Cyber Kill Chain reduce its cost?
Distinguish the jobs of SIEM, SOAR, EDR, and XDR.
What does a threat hunter prioritize over indicators of compromise, and why?
Answers: (1) Earlier stages (recon, delivery) precede damage, so breaking the chain there prevents the costly later stages (installation, C2, actions on objectives). (2) SIEM aggregates and correlates logs to alert; SOAR automates and orchestrates response via playbooks; EDR detects/responds on endpoints; XDR unifies endpoint, network, identity, and cloud telemetry into one correlated layer. (3) Durable TTPs (tactics, techniques, procedures) over IOCs, because attackers change indicators (hashes, IPs) easily but changing their behavior is costly, so TTP-based detection is harder to evade.
12.5 The Cyber Kill Chain and MITRE ATT&CK#
Detection is most effective when organized around how attackers actually operate, and two models dominate. The Cyber Kill Chain (Lockheed Martin) describes an intrusion as seven sequential stages, reconnaissance, weaponization, delivery, exploitation, installation, command and control (C2), and actions on objectives, and its defensive value is that the earlier in the chain a defender detects and breaks it, the cheaper the incident. A scan caught at reconnaissance (Chapter 8) is far less costly than ransomware caught at actions on objectives. The kill chain is linear and attacker-centric, which is also its limitation against modern, non-linear intrusions.
A burglary is not one event, it is a sequence: choosing the street, watching the house, obtaining a key, entering, taking things, leaving. The kill chain says the same about an intrusion, and the useful consequence is that defense does not have to succeed at the door. Breaking any single stage ends the attempt, and breaking an early one is cheaper, because at the reconnaissance stage nothing has been lost yet while at the exfiltration stage the question has already become how much. A burglary runs start to finish in order and intrusions do not. Attackers loop back, skip stages, run several in parallel across different hosts, and regain access through a door they left open weeks earlier. That is the reason the MITRE ATT&CK matrix described below is a matrix of techniques rather than a chain, and the chain is best used for deciding where to place defenses rather than for narrating what happened.
Introduced by Lockheed Martin in 2011 (Hutchins, Cloppert, and Amin, Intelligence-Driven Computer Network Defense Informed by Analysis of Adversary Campaigns and Intrusion Kill Chains), the seven stages are:
Reconnaissance – the attacker researches and selects targets (Chapter 7).
Weaponization – a deliverable payload is built, for example a malicious document that couples an exploit with a backdoor.
Delivery – the weapon is transmitted to the target (email attachment, malicious link, USB, or watering-hole site).
Exploitation – the delivered code executes by exploiting a vulnerability or user action (Chapter 9).
Installation – malware installs and establishes persistence on the victim.
Command and Control (C2) – the implant beacons out, giving the attacker remote control.
Actions on Objectives – only now does the attacker pursue the goal: data theft, encryption, destruction, or lateral movement.
For each stage a defender can apply one of Lockheed Martin’s six courses of action, detect, deny, disrupt, degrade, deceive, and destroy, forming a matrix of defensive options against every step. Because the stages are sequential, breaking any single link defeats the whole intrusion, and breaking it early (at delivery rather than at actions on objectives) is dramatically cheaper.
MITRE ATT&CK complements it with a detailed, empirically derived knowledge base of adversary tactics (the why, such as Persistence or Lateral Movement), techniques (the how, such as pass-the-hash), and real-world procedures. ATT&CK is versioned and evolves: the April 2026 v19 release, for example, split the long-standing Defense Evasion tactic into Stealth (hiding within legitimate behavior) and Defense Impairment (disabling or degrading controls), so detection coverage should always be tracked against the current matrix. Where the kill chain gives a high-level narrative, ATT&CK gives a granular matrix that maps directly to detections: a SOC measures its coverage by which ATT&CK techniques it can detect, and detection engineering (below) writes rules technique by technique. Together they turn raw telemetry into purposeful detection, ensuring sensors watch for what attackers really do rather than only for known-bad signatures.
        flowchart LR
    R[Recon] --> W[Weaponize] --> D[Deliver] --> E[Exploit] --> I[Install] --> C[C2] --> A[Actions on objectives]
    R -.detect early = cheap.-> X[Break the chain]
    A -.detect late = costly.-> X
12.6 Modern SOC Operations: EDR, XDR, SOAR, and Detection Engineering#
The detection methods above describe how individual sensors decide what is suspicious. A modern security operations center (SOC) ties those sensors together. Endpoint Detection and Response (EDR) instruments hosts to record process, file, registry, and network activity, detect malicious behavior, and allow remote investigation and containment such as isolating a machine. Extended Detection and Response (XDR) correlates that endpoint telemetry with network, identity, email, and cloud signals so that an alert reflects an attack across layers rather than one isolated event. Security Orchestration, Automation, and Response (SOAR) then automates the repetitive parts of handling an alert through playbooks that enrich indicators, open tickets, and take pre-approved containment actions, which reduces the time analysts spend on routine work.
Detection engineering is the discipline of writing, testing, and maintaining detections as code rather than relying on vendor signatures alone. Engineers map their coverage to adversary techniques (commonly using MITRE ATT&CK), write rules against that map, and tune them to balance false positives against missed detections. Sigma is a vendor-neutral, YAML-based rule format for log-based detections that can be converted into the query language of a specific SIEM, so a detection can be written once and shared across tools and teams. Together EDR, XDR, SOAR, and detection engineering turn a SOC from a queue of disconnected alerts into a measurable, continuously improving capability.
12.7 Writing Detection Rules: Snort, YARA, and Sigma#
Detection engineering (Section 12.6) is only real when it is expressed as rules that run against traffic, files, and logs. Three rule languages dominate, one per data source, and fluency in all three is a core skill.
Network rules (Snort and Suricata). Signature-based network intrusion detection matches patterns in packets. A Snort or Suricata rule has an action, a protocol and address or port header, and options that specify what to match and what to report.
# Alert on a cleartext HTTP request carrying a known web-shell filename
alert tcp $EXTERNAL_NET any -> $HOME_NET 80 ( \
    msg:"WEB-SHELL possible c99 access"; flow:to_server,established; \
    content:"GET"; http_method; content:"/c99.php"; http_uri; nocase; \
    classtype:web-application-attack; sid:1000001; rev:1; )
The flow keyword restricts the match to an established client-to-server stream, content with the http_uri
modifier scopes the match to the request URI, and the sid uniquely identifies the rule. Signatures are exact
and fast but blind to anything they were not written for, which is why they are paired with the anomaly and
behavioral methods of Section 12.2.
File rules (YARA). YARA classifies files and memory by content, and it is the lingua franca for sharing malware detections (Chapter 15).
rule Suspicious_PowerShell_Downloader {
    meta:
        author = "SOC"
        description = "PowerShell one-liner that downloads and executes"
    strings:
        $a = "IEX" nocase
        $b = "New-Object Net.WebClient" nocase
        $c = "DownloadString" nocase
        $d = "-enc" nocase          // base64-encoded command
    condition:
        2 of ($a, $b, $c) or $d
}
Log rules (Sigma). Sigma is the vendor-neutral rule format for logs (Section 12.6). It is written once in YAML and converted to the query language of whatever SIEM the organization runs, so a detection can be shared across tools and teams.
title: Office application spawning a command shell
logsource:
    category: process_creation
    product: windows
detection:
    selection:
        ParentImage|endswith:
            - '\winword.exe'
            - '\excel.exe'
            - '\outlook.exe'
        Image|endswith:
            - '\cmd.exe'
            - '\powershell.exe'
    condition: selection
level: high
This single rule encodes the classic macro-malware signature that also appeared in memory forensics (Section 13.13): a document application becoming the parent of a shell.
12.8 SIEM Correlation and Tuning#
A SIEM (Section 12.3) collects logs centrally; its value is turning many low-value events into a few high-confidence alerts through correlation. The archetypal example is brute-force detection: one failed login is noise, but many failures followed by a success is an alarm. The logic is simple enough to write out, which is the point of the lab.
# Correlation over an authentication log: flag accounts with a burst of failures
# followed by a success from the same source (credential stuffing / brute force).
from collections import defaultdict

events = [  # (timestamp_seconds, user, source_ip, outcome)
    (100, "alice", "10.0.0.5", "fail"), (103, "alice", "10.0.0.5", "fail"),
    (106, "alice", "10.0.0.5", "fail"), (109, "alice", "10.0.0.5", "fail"),
    (112, "alice", "10.0.0.5", "success"),                      # <- suspicious
    (200, "bob",   "10.0.0.9", "fail"),  (900, "bob", "10.0.0.9", "success"),  # slow, benign
]

WINDOW, THRESHOLD = 60, 3   # >=3 failures within 60s then a success
fails = defaultdict(list)
alerts = []
for ts, user, ip, outcome in events:
    key = (user, ip)
    if outcome == "fail":
        fails[key].append(ts)
    elif outcome == "success":
        recent = [t for t in fails[key] if ts - t <= WINDOW]
        if len(recent) >= THRESHOLD:
            alerts.append(f"ALERT: {user} from {ip} succeeded after {len(recent)} failures in {WINDOW}s")
        fails[key].clear()

for a in alerts: print(a)
print(f"{len(alerts)} correlation alert(s) from {len(events)} raw events")
The hard part of a SIEM is not writing detections but tuning them. Two error types trade off: a false positive wastes analyst time and, in volume, causes alert fatigue that hides real incidents; a false negative is a missed attack. Tuning narrows rules with context (exclude known scanners, require corroborating events, raise thresholds for noisy sources) and prioritizes by asset criticality, so the analyst sees the alerts that matter. The governing metric is the true-positive rate against the false-positive cost: a detection that fires a thousand times a day is worse than useless even if it is occasionally right, because the real alert drowns. This is why detection engineering (Section 12.6) treats rules as code with version control, testing against known-bad and known-good samples, and continuous measurement of coverage against MITRE ATT&CK.
Exercises#
Write, in words, a Sigma-style detection for a process creating a scheduled task from a user’s temporary directory, and name one benign case you would have to exclude.
In the correlation lab, why does the condition require failures followed by a success rather than failures alone?
A Snort rule fires 5,000 times a day and is right twice. State the problem this creates and two tuning actions that address it.
Which of the three rule languages (Snort, YARA, Sigma) would you use to detect a known-malicious binary arriving over the network, sitting on disk, and being executed, respectively?
Answer Key#
Match
process_creationwhere the parent or image path is under\Temp\and the created object is a scheduled task (schtasks.exeor Task Scheduler); exclude legitimate software installers and updaters that stage from temporary directories.Failures alone indicate an attempt; a subsequent success from the same source indicates the attempt worked, which is the event that warrants response, so pairing them raises confidence and cuts false positives.
It causes alert fatigue that buries real detections; tune by adding context to narrow the match (exclude known-benign sources, require a corroborating event) and by raising the threshold or lowering the rule’s priority so it no longer competes with high-value alerts.
Network: Snort/Suricata; on disk: YARA; on execution (from logs): Sigma.
12.9 Network Security Monitoring#
Signature rules (Section 12.7) catch known-bad packets; network security monitoring (NSM) provides the
broader visibility that catches the unknown. NSM combines three data types. Full packet capture records
every byte (with tools such as tcpdump and Wireshark, Chapter 3), giving perfect fidelity at high storage
cost, so it is usually kept only briefly or around alerts. Session and flow data (NetFlow, IPFIX, and Zeek’s
connection logs) records who talked to whom, when, how much, and for how long, a compact summary that scales to
enterprise volume and is ideal for spotting beaconing and exfiltration. Protocol metadata from Zeek (the
NSM engine formerly called Bro) parses connections into rich logs: DNS queries, HTTP requests, TLS
certificates, and file transfers, each a searchable record. The analytic power of NSM is in flow analysis: a
host that connects to the same external address at a fixed interval is beaconing to a command-and-control
server (Chapter 15), and a host that suddenly uploads gigabytes to an unfamiliar destination is exfiltrating,
patterns invisible to a per-packet signature but obvious in the flow record.
12.10 Host Telemetry and EDR Internals#
Detection has shifted toward the endpoint because that is where code actually executes. The endpoint detection and response agents of Section 12.6 instrument the operating system to record process creation with full command lines and parent-child relationships, file and registry changes, network connections, and module loads. On Windows the open-source Sysmon provides much of this telemetry for free, writing detailed event logs (process creation with hashes, network connections, image loads, and more) that feed the Sigma rules of Section 12.7 and the forensic timeline of Section 13.14. The reason host telemetry is so valuable is that it sees behavior encryption hides from the network: a TLS-encrypted command-and-control channel is opaque on the wire, but the process that opened it, its parent, and its command line are fully visible on the host. This is why the classic detections in this book, an Office application spawning PowerShell, a process writing and then executing from a temporary directory, injected and unbacked executable memory, are all host behaviors.
12.11 Threat Hunting#
Detection engineering waits for a rule to fire; threat hunting proactively looks for intruders that no rule caught, on the assumption that prevention has already failed somewhere (the assume-breach mindset of Section 14.4). A hunt is hypothesis-driven: the hunter forms a specific, testable idea grounded in adversary behavior (for example, “an attacker is using scheduled tasks for persistence”), queries the telemetry of Sections 12.9 and 12.10 for evidence, and either finds activity to investigate or refines the hypothesis. A worked hunt for command-and-control beaconing shows the method: rather than match a known-bad domain, the hunter looks for the statistical signature of automated callbacks, connections to one destination at suspiciously regular intervals.
# Threat hunt: find beaconing by low variance in the time between connections
# to a destination (automated callbacks are regular; human traffic is bursty).
import statistics

# (timestamp_seconds, source, destination) connection records from flow logs
conns = [(t, "10.0.0.5", "cdn.example") for t in (0, 61, 118, 205, 400)] + \
        [(t, "10.0.0.7", "evil.example") for t in (0, 300, 600, 900, 1200, 1500)]

from collections import defaultdict
by_pair = defaultdict(list)
for t, src, dst in conns:
    by_pair[(src, dst)].append(t)

print(f"{'source -> destination':30} {'count':>5} {'mean gap':>9} {'stdev':>7}  verdict")
for (src, dst), times in by_pair.items():
    times.sort()
    gaps = [b - a for a, b in zip(times, times[1:])]
    if len(gaps) < 3:
        continue
    mean, sd = statistics.mean(gaps), statistics.pstdev(gaps)
    jitter = sd / mean if mean else 1.0        # low jitter -> machine-like regularity
    verdict = "BEACON (regular)" if jitter < 0.1 else "likely human"
    print(f"{src+' -> '+dst:30} {len(times):5d} {mean:9.1f} {sd:7.1f}  {verdict}")
The evil destination’s near-zero jitter (identical 300-second gaps) marks it as an automated beacon, while the content-network traffic is irregular and benign. Real hunts add randomized-jitter handling, allowlisting of known services, and enrichment, but the hypothesis-and-evidence loop is the same. Findings from hunting feed back into detection engineering (Section 12.6): a successful hunt becomes a permanent detection rule, so the same intruder is caught automatically next time.
Exercises#
You must detect data exfiltration over an encrypted channel. Which NSM data type is most useful, and what pattern do you look for?
A command-and-control channel uses TLS, so its contents are unreadable. Explain why endpoint telemetry can still detect it.
Convert this hunting hypothesis into the specific telemetry you would query: “an attacker established persistence via a new Windows service.”
In the beaconing lab, why is a low ratio of standard deviation to mean inter-arrival time evidence of automation rather than human activity?
Answer Key#
Session or flow data (NetFlow, Zeek connection logs): look for a host uploading an unusually large volume to an unfamiliar external destination, visible even though the payload is encrypted.
Encryption hides the payload but not the host behavior; endpoint telemetry records the process that opened the connection, its parent process, command line, and module loads, which reveal the malicious program.
Query process-creation and service-install events (for example Windows event ID 7045 and Sysmon service creation) for new services, especially those with unusual binary paths, unsigned images, or creation by non-administrative processes.
Automated beacons fire at a fixed interval, so their inter-arrival gaps have very low variance relative to the mean; human-driven traffic is bursty and irregular, producing a high ratio.
12.12 Deception: Honeypots and Honeytokens#
Most detection waits for an attacker to trip a rule; deception makes the attacker announce themselves. A honeypot is a decoy system with no legitimate purpose, so any interaction with it is, by definition, suspicious, which yields near-zero false positives, the opposite of the tuning problem in Section 12.8. Honeypots range from low-interaction (emulated services that log connection attempts) to high-interaction (real systems, instrumented and isolated, that let an attacker fully engage while every action is recorded). A honeytoken is the same idea shrunk to a single artifact: a fake credential, a decoy document, a canary file, or a database row that no legitimate process should ever touch, so an alert on its use is a high-confidence sign of compromise, and honeytokens placed inside a network detect the lateral-movement and credential-theft stages of an intrusion (Chapter 9) that perimeter tools miss. Because a decoy fires only on real malicious activity, deception is a powerful complement to the statistical detection of Sections 12.9 through 12.11: it trades coverage for precision, catching fewer things but almost never crying wolf. Deception connects back to the honeynets and honeytokens of Chapter 11’s network-defense material.
12.13 Log Sources, Normalization, and the SOC Workflow#
A SIEM (Section 12.3) is only as good as the logs it ingests, and getting logs into a usable state is unglamorous but decisive work. The essential sources are authentication and directory logs (who logged in where), endpoint and Sysmon telemetry (Section 12.10), network and DNS logs (Section 12.9), firewall and proxy logs, cloud audit trails (Section 13.11), and application logs. These arrive in incompatible formats, so the first job is normalization: parsing each source into a common schema (a shared field naming for user, host, source and destination address, action, and outcome) so that a single query can correlate across all of them. The lab below shows the parse-and-normalize step that precedes any correlation.
Log Management: Retention, Integrity, and the Questions Logs Must Survive#
Section 12.13 covered where logs come from and how they are normalized for detection. Detection is not the only thing logs are for, and it is not the use that determines how long you keep them. A detection pipeline cares about the last few minutes. An investigation cares about the last few months. A regulator, a plaintiff, or a breach-notification deadline may care about the last several years.
Retention is a policy decision with a cost curve, not a technical default. The controlling fact is dwell time: intrusions are routinely discovered months after initial access, so a ninety-day retention window can mean the earliest evidence of a compromise has already expired on the day you start looking for it. Against that, full-fidelity retention is expensive, which is why mature programs tier their storage: hot for days, warm for months, cold archive for years, with the fidelity of what is kept decreasing as it ages.
Regimes that impose explicit minimums include PCI DSS, which requires a year of audit history with ninety days immediately available, and a range of sector rules under HIPAA, SOX, and GDPR that set their own floors. The common student error is to treat these as security requirements. They are evidentiary requirements: they exist so that a question asked later can still be answered.
Integrity matters more than volume. An attacker who reaches a host will try to erase the record of having been there, and on Windows clearing the Security log is itself a logged event (Event ID 1102), which is why that single event is one of the highest-value detections in any SIEM. The structural defense is to get logs off the host quickly, because a log that exists only where the attacker has administrative control is not evidence. Techniques that make the record durable include:
Write-once storage or append-only object stores, so history cannot be rewritten
Remote forwarding within seconds of generation, shrinking the window for tampering
Cryptographic chaining, where each entry commits to a hash of its predecessor, so any deletion or edit breaks the chain (the same construction as the hash chains of Chapter 2)
Time synchronization via the Network Time Protocol (NTP), without which correlating events across systems, and defending that correlation later, becomes impossible
Logging what matters, and the failure of logging everything. Two opposite failures are common. Under-logging leaves no record of the actions that matter: authentication outcomes, privilege escalation, configuration change, data access, and account lifecycle events (Chapter 11). Over-logging produces volume nobody reviews, drives licensing costs that eventually force indiscriminate cuts, and buries signal. The discipline is to log by question: for each event class, name the investigative question it would answer, and drop what answers nothing.
Legal hold overrides retention. Once litigation or an investigation is reasonably anticipated, normal deletion schedules must stop for the relevant data. An automated ninety-day purge that quietly destroys material under hold is spoliation, and it is a failure of process rather than of technology. This is where detection engineering meets governance (Chapter 19) and forensics (Chapter 13): the evidentiary value of a log depends on being able to show who could have altered it, and when.
NIST SP 800-92 remains the standard reference for building the program around these constraints.
# Normalize heterogeneous log lines into one schema so they can be correlated.
import re

raw = [
    ("sshd",    "Failed password for alice from 10.0.0.5 port 4021 ssh2"),
    ("firewall","DENY TCP 203.0.113.9:5544 -> 10.0.0.7:3389"),
    ("win",     "An account failed to log on: Account Name: bob  Source Network Address: 10.0.0.9"),
]

def normalize(source, line):
    ev = {"source": source, "user": None, "src_ip": None, "action": None, "outcome": None}
    if source == "sshd":
        m = re.search(r"Failed password for (\S+) from (\S+)", line)
        if m: ev.update(user=m.group(1), src_ip=m.group(2), action="auth", outcome="fail")
    elif source == "firewall":
        m = re.search(r"DENY \w+ (\d+\.\d+\.\d+\.\d+):\d+", line)
        if m: ev.update(src_ip=m.group(1), action="network", outcome="deny")
    elif source == "win":
        u = re.search(r"Account Name:\s*(\S+)", line); ip = re.search(r"Source Network Address:\s*(\S+)", line)
        ev.update(user=u.group(1) if u else None, src_ip=ip.group(1) if ip else None,
                  action="auth", outcome="fail")
    return ev

for src, line in raw:
    print(normalize(src, line))
Above the SIEM sits the security operations center (SOC) workflow that turns alerts into decisions. Alerts are triaged in tiers: a Tier-1 analyst validates and closes or escalates high volumes of alerts against a runbook; a Tier-2 analyst investigates the escalations in depth; and Tier-3 threat hunters and incident responders (Sections 12.11 and Chapter 14) handle the confirmed intrusions. The governing reality is alert volume: a SOC receives far more alerts than it can investigate, so the discipline is prioritization by asset criticality and confidence (Section 12.8), and automation (the SOAR playbooks of Section 12.6 and 14.12) to handle the repetitive cases, leaving humans for judgment. A SOC drowning in low-value alerts misses the real one, which is why detection engineering and tuning are not housekeeping but the core of the job.
12.14 Evading Detection#
Understanding how attackers defeat detection is essential to building it well. Against network signatures
(Section 12.7), attackers use fragmentation (splitting an attack across packets so no single packet matches),
encoding and obfuscation (URL-encoding or otherwise disguising a payload the signature expects verbatim),
and encryption (TLS hides the payload entirely, which is why detection has shifted to endpoints and
metadata). Against host and log detection, attackers use the living-off-the-land technique of abusing
built-in, trusted tools (PowerShell, certutil, wmic) so their activity blends with legitimate
administration (Chapter 15), and they clear or tamper with logs (Section 13.21). Timing attacks slow an
operation below detection thresholds. The defensive answer is defense in depth across data sources: an attack
that evades the network signature is still visible in the endpoint process tree, and one that clears local logs
is still recorded in the central SIEM and the honeytoken it tripped. No single sensor is sufficient, which is
the unifying argument of this chapter.
Exercises#
Why does a honeypot have a near-zero false-positive rate, and what does it trade away to get it?
Before a SIEM can correlate a failed SSH login with a firewall denial from the same address, what processing must happen to the two log lines, and why?
A SOC receives 40,000 alerts a day and can investigate 400. Name the two levers (from this chapter) that make this survivable.
An attacker fragments an exploit across several packets to evade a network signature. Explain why the attack may still be detected, using defense in depth.
Answer Key#
A honeypot has no legitimate use, so any interaction is inherently suspicious and rarely a false alarm; it trades coverage, since it only sees attackers who happen to touch the decoy, for that precision.
Both must be normalized into a common schema (shared fields for user, source address, action, outcome) so a single query can match them; without normalization their incompatible formats cannot be correlated.
Prioritization by asset criticality and alert confidence (tuning, Section 12.8) and automation of repetitive cases with SOAR playbooks, leaving analysts for high-value judgment.
Fragmentation may defeat the per-packet network signature, but the same attack is still visible in endpoint telemetry (the process it spawns) and in reassembled session or protocol logs, so a layered detection catches what one sensor misses.
12.15 Case Study: Detecting an Intrusion Across the Kill Chain#
Real detection rarely comes from one alert; it comes from stitching weak signals across data sources into a confident picture. Follow one intrusion as each stage leaves a trace, mapped to MITRE ATT&CK (Section 12.5), and note which sensor sees it.
Initial access (phishing, T1566). A user opens a macro-enabled attachment. The endpoint records winword.exe
spawning powershell.exe, the Sigma rule of Section 12.7 and the host telemetry of Section 12.10. Alone it is
a medium-confidence alert, common enough to be tuned down.
Execution and command-and-control (T1059, T1071). The PowerShell process makes an outbound HTTPS connection that recurs at a fixed interval. Network flow analysis (Section 12.9) flags the low-jitter beacon, and Zeek’s TLS log shows a self-signed certificate. Now two independent sources point at the same host.
Discovery and credential access (T1087, T1003). The same host runs net group "domain admins" and touches
the LSASS process, the signature of credential dumping. Endpoint telemetry and a Sysmon process-access event
capture it, corroborating malicious intent.
Lateral movement (T1021). Authentication logs show the compromised account making network logons to several servers in minutes, the impossible-speed pattern the correlation of Section 12.8 detects, and a honeytoken credential (Section 12.12) planted on the first host is used, firing a near-certain alert.
The correlated verdict. No single event proved an intrusion, but the sequence, phishing lineage, beaconing, credential access, and honeytoken use on one account and host within an hour, is unambiguous. This is the core skill of detection: individual alerts are noisy, but their co-occurrence in an ATT&CK-ordered chain is high-confidence. The lab below performs exactly this correlation, raising an incident when several distinct ATT&CK stages implicate the same host in a short window.
# Cross-source correlation: raise an incident when one host shows events from
# several distinct ATT&CK tactics within a time window (kill-chain progression).
from collections import defaultdict

# (time_seconds, host, attack_tactic)  from normalized multi-source telemetry
events = [
    (10, "WKS-7", "initial-access"), (70, "WKS-7", "command-and-control"),
    (130,"WKS-7", "credential-access"), (200,"WKS-7", "lateral-movement"),
    (50, "WKS-3", "command-and-control"),                 # single weak signal
]

WINDOW, MIN_TACTICS = 3600, 3
seen = defaultdict(list)   # host -> list of (time, tactic)
for t, host, tactic in events:
    seen[host].append((t, tactic))

for host, hits in seen.items():
    hits.sort()
    recent = [(t, tac) for t, tac in hits if hits[-1][0] - t <= WINDOW]
    tactics = {tac for _, tac in recent}
    if len(tactics) >= MIN_TACTICS:
        print(f"INCIDENT on {host}: {len(tactics)} ATT&CK tactics in {WINDOW}s -> {sorted(tactics)}")
    else:
        print(f"low confidence on {host}: only {sorted(tactics)}")
12.16 Measuring and Maturing Detection#
A detection program, like the response program of Chapter 14, is judged by numbers. Coverage is measured against the MITRE ATT&CK matrix: for each technique relevant to the organization’s threat model, is there a detection, is it tested, and how quickly does it fire? Tools such as the ATT&CK Navigator visualize this as a heat map, turning “are we covered?” into a concrete gap list. Quality is measured by the precision and recall of detections (the false-positive and false-negative trade-off of Section 12.8) and by the detection’s time to fire. The maturity path runs from ad-hoc, buy-a-tool-and-hope detection, through documented and tuned rules, to detection-as-code with version control, automated testing against known-bad and known-good samples, continuous measurement, and a feedback loop from threat hunting (Section 12.11) and incident postmortems (Chapter 14) that converts every missed detection into a new rule. The organizing insight of this chapter is that detection is an engineering discipline with metrics and iteration, not a product you install: the tools detect, but only a measured, tuned, continuously improved program detects the right things fast enough to matter.
Exercises#
In the case study, the phishing-lineage alert alone was tuned down as low-value. Explain why it became high-confidence in context, and what property of the evidence made the difference.
Map each observed behavior to its data source: an Office app spawning PowerShell; a fixed-interval HTTPS beacon; access to LSASS; use of a planted decoy credential.
In the correlation lab, why does requiring several distinct ATT&CK tactics on one host reduce false positives compared with alerting on any single tactic?
What does measuring detection coverage against the ATT&CK matrix tell a SOC that counting alerts does not?
Answer Key#
In isolation it is common and noisy, but co-occurring with beaconing, credential access, and honeytoken use on the same host in a short window, in kill-chain order, it becomes unambiguous; the correlation of multiple independent signals is what raises confidence.
Office spawning PowerShell = endpoint/Sysmon process-creation telemetry; fixed-interval beacon = network flow analysis; LSASS access = endpoint process-access (Sysmon); decoy credential use = honeytoken alert.
A single tactic can be benign or a false positive, but the coincidence of several distinct attack stages on one host in a short window is very unlikely to be innocent, so the compound condition is far more precise.
It shows which adversary techniques the SOC can and cannot detect (its true gaps), whereas counting alerts measures noise volume, not coverage.
12.17 A Detection Content Library#
Detection engineering is easier with a starting library of high-value detections that generalize across environments. The following behaviors, drawn from the ATT&CK techniques most common in real intrusions, are worth deploying and tuning first; each is expressible as the Sigma, Snort, or YARA rules of Section 12.7.
Behavior to detect |
Why it matters |
Primary source |
|---|---|---|
Office application spawning a shell ( |
Macro-malware initial access |
Endpoint / Sysmon |
Encoded or download-and-execute PowerShell ( |
Fileless execution |
PowerShell 4104, Sysmon |
Process writing then executing from |
Dropper behavior |
Endpoint |
Access to LSASS by a non-system process |
Credential dumping |
Sysmon process-access |
New service or scheduled task from an unusual path |
Persistence |
Events 7045, 4698 |
|
Ransomware pre-encryption |
Endpoint / 4688 |
Regular-interval outbound connection (low jitter) |
Command-and-control beacon |
Network flow / Zeek |
Many auth failures then a success from one source |
Brute force / password spray |
Auth logs 4625/4624 |
Clearing of the security event log (event 1102) |
Anti-forensics |
Security log |
Use of a honeytoken credential or file |
High-confidence compromise |
Deception (Section 12.12) |
Two principles guide the library. Detections should target behavior rather than literals wherever possible (the pyramid of pain, Section 15.12), because behavior is costly for an attacker to change. And every detection should be mapped to an ATT&CK technique (Section 12.16) so coverage is measurable and gaps are visible. This list is not exhaustive, but an organization that reliably detects these behaviors has raised its defensive floor above most real-world intrusions.
12.18 Lab: A Mini Detection Pipeline#
The pieces of this chapter, ingest, normalize, detect, and alert, form a pipeline. The lab below wires them into a small end-to-end example: it takes raw multi-source events, normalizes them (Section 12.13), runs a set of detection rules (Section 12.7), and correlates the hits per host (Sections 12.8 and 12.15) into a prioritized alert, the skeleton of what a SIEM does at scale.
# A minimal detection pipeline: normalize -> detect -> correlate -> alert.
from collections import defaultdict

raw = [  # (source, host, message)
    ("sysmon", "WKS-7", "ParentImage=winword.exe Image=powershell.exe CommandLine=-enc SQBFAFgA"),
    ("net",    "WKS-7", "beacon dst=evil.example interval=60 jitter=0.02"),
    ("sysmon", "WKS-7", "ProcessAccess Target=lsass.exe Granted=0x1010"),
    ("sysmon", "WKS-3", "ParentImage=explorer.exe Image=notepad.exe"),
]

def normalize(source, msg):
    return {"source": source, "text": msg.lower()}

# Each rule: (name, ATT&CK id, predicate)
RULES = [
    ("Office spawns shell", "T1059", lambda e: "winword.exe" in e["text"] and "powershell" in e["text"]),
    ("Encoded PowerShell",  "T1027", lambda e: "-enc" in e["text"]),
    ("C2 beacon",           "T1071", lambda e: "beacon" in e["text"] and "interval=" in e["text"]),
    ("LSASS access",        "T1003", lambda e: "lsass.exe" in e["text"] and "processaccess" in e["text"]),
]

hits = defaultdict(set)   # host -> set of ATT&CK ids
for source, host, msg in raw:
    e = normalize(source, msg)
    for name, tid, pred in RULES:
        if pred(e):
            hits[host].add(tid)
            print(f"HIT {host}: {name} ({tid})")

print("\n--- correlated alerts ---")
for host, tids in hits.items():
    sev = "HIGH incident" if len(tids) >= 3 else "investigate" if len(tids) == 2 else "low"
    print(f"{host}: {len(tids)} distinct ATT&CK techniques {sorted(tids)} -> {sev}")
Exercises#
From the content library, pick the three detections you would deploy first for a small organization with no SOC, and justify each in one sentence.
The library favors behavioral detections over literal indicators. Restate the reason using the pyramid of pain.
In the pipeline lab, WKS-7 triggered three techniques and WKS-3 none. Why is the multi-technique host a much stronger alert than any single rule hit?
Why is mapping every detection to an ATT&CK technique valuable beyond the detection itself?
Answer Key#
Any three of, for example: Office spawning a shell (catches common phishing execution),
vssadmin delete shadows(catches ransomware before encryption), and brute-force-then-success on authentication (catches account takeover); each targets a frequent, high-impact stage.Attackers change literals (hashes, IPs, domains) cheaply but change behavior (tactics and techniques) at real cost, so behavioral detections at the top of the pyramid stay effective across samples and campaigns.
A single technique can be benign or a false positive; several distinct attack techniques converging on one host in a short window is very unlikely to be innocent, so the correlated signal is high-confidence.
It makes coverage measurable against the full matrix, exposes gaps, enables communication in a shared vocabulary, and connects detection to threat intelligence and incident response.
12.19 Packet Analysis for Detection#
Network-based detection (Section 12.9) ultimately reasons about packets, so an analyst must be able to open a
capture and read it. This section walks packet analysis with Wireshark and its command-line sibling tshark,
the tools every SOC uses to confirm or refute an alert.
A packet capture (PCAP) is a recording of frames seen on a link. The analyst’s job is to filter the haystack down to the relevant flow and then read the conversation. Wireshark’s display filters are the core skill:
ip.addr == 10.0.0.50                 # all traffic to or from a host
tcp.port == 443 and tls.handshake    # TLS handshakes (read the SNI / cert)
http.request.method == "POST"        # data being sent out
dns.qry.name contains "example"      # DNS lookups matching a pattern
tcp.flags.syn == 1 and tcp.flags.ack == 0   # connection attempts (scanning)
frame contains "powershell"          # a byte pattern anywhere in the frame
The same logic works headless for scripting and triage, which is how you process captures at scale:
# Extract every DNS query name from a capture, then rank by frequency
$ tshark -r capture.pcap -Y "dns.flags.response == 0" -T fields -e dns.qry.name \
     | sort | uniq -c | sort -rn | head
# Pull the SNI (server name) from TLS client hellos to see where TLS went
$ tshark -r capture.pcap -Y "tls.handshake.type == 1" \
     -T fields -e tls.handshake.extensions_server_name
Reading a beacon in a capture. The command-and-control traffic of Section 12.11 has a recognizable shape in a PCAP: repeated connections to the same destination at near-regular intervals, each small and similar in size. Following the TCP stream (Wireshark’s Follow > TCP Stream) reveals the request and response bodies; even over TLS, the timing and size pattern and the destination SNI or JA3 fingerprint betray the beacon when the payload is opaque. This is the packet-level view of the beaconing-detection code in Section 12.11 and connects directly to extracting network indicators for detection content (Section 12.17).
From packet to detection. Once you have identified a malicious pattern in a capture, you encode it as a rule: a Suricata signature on the destination and JA3, a Zeek script on the connection regularity, or a Sigma rule on the proxy logs that record the same requests (Section 12.7). The capture is where a hypothesis becomes a confirmed indicator, and the rule is how that indicator becomes durable, automated detection. Being able to move fluently from a raw PCAP to a deployed signature is the defining skill of network detection engineering.
Exercises#
What is a display filter, and why is it the core skill of packet analysis?
Give a
tsharkapproach to finding the most frequently queried DNS names in a capture.How can a C2 beacon be recognized in a packet capture even when the payload is TLS-encrypted?
Describe the path from spotting a malicious pattern in a PCAP to durable automated detection.
Answer Key#
A display filter selects the subset of frames matching a Boolean expression over protocol fields; it reduces a large capture to the relevant conversation so the analyst can actually read the traffic.
Use
tshark -r capture.pcap -Y "dns.flags.response == 0" -T fields -e dns.qry.name, then sort and count withsort | uniq -c | sort -rnto rank query names by frequency.By its timing and size regularity (repeated small connections to one destination at near-fixed intervals) plus the destination SNI or JA3/TLS fingerprint, none of which require decrypting the payload.
Identify and confirm the pattern in the capture, extract the indicators (destination, JA3, interval), then encode them as a Suricata/Zeek/Sigma rule so the detection runs automatically thereafter.
12.20 Building and Tuning a Detection, End to End#
Sections 12.7 and 12.16 covered rule syntax and measuring detection; this section ties them together into the detection-engineering lifecycle, the repeatable process by which a threat report becomes a trustworthy, low-noise alert. Writing a rule is easy; making one that fires on real attacks and stays quiet otherwise is the actual craft.
The lifecycle runs in six steps:
1. Source the behavior. Take a specific technique from a threat report or
   ATT&CK (e.g., T1053 scheduled-task persistence) and state exactly what
   observable it produces (a process-creation event for schtasks.exe with
   a suspicious command line).
2. Choose the right telemetry. Decide where the observable is visible:
   EDR process events (Section 12.10), Windows event ID 4688/4104, or
   network logs. Detection is only as good as the data feeding it.
3. Write the logic. Express it as a Sigma rule (portable) or native rule,
   keyed on stable fields, not on an attacker-changeable string where a
   behavioral field exists (the pyramid of pain, Section 15.12).
4. Test for true positives. Run the technique in a lab (Atomic Red Team)
   and confirm the rule fires. A rule never validated against the real
   behavior is a guess.
5. Tune for false positives. Run the rule against historical benign data,
   measure the false-positive rate (Section 12.16), and add exceptions for
   legitimate administrative uses until the precision is acceptable.
6. Document and deploy. Record the technique, data source, logic, known
   false positives, and the response action, then ship it to the SIEM and
   add it to the detection library (Section 12.17).
The discipline lives in steps 4 and 5. A rule with high recall but low precision floods analysts and trains them to ignore alerts (alert fatigue, Section 12.16); a rule with high precision but low recall silently misses the attack. The engineer balances the two by preferring behavioral fields, validating against both malicious and benign data, and reviewing rules as the environment changes. This is why detection content is treated as living code, version-controlled, tested, and maintained (detection-as-code), rather than written once and forgotten. The output feeds directly into the incident-response pipeline of Chapter 14: a well-tuned detection is what starts a real investigation instead of a wild-goose chase.
Exercises#
Why is writing a rule the easy part, and what is the actual difficulty in detection engineering?
What does step 2 (choose the right telemetry) protect against?
Contrast the failure modes of a high-recall/low-precision rule and a high-precision/low-recall rule.
What does treating detection content as code (version-controlled, tested) provide?
Answer Key#
Expressing logic is straightforward; the difficulty is making the rule fire reliably on real attacks (recall) while staying quiet on benign activity (precision), which requires validation and tuning.
Writing a rule for an observable that the available data does not actually record; detection is only as good as the telemetry feeding it, so the data source must be chosen deliberately.
High recall/low precision floods analysts with false positives and causes alert fatigue; high precision/low recall keeps the queue clean but silently misses real attacks. The engineer balances the two.
Reproducibility, review, and maintainability: rules can be tested, tracked as the environment changes, and improved over time rather than decaying as undocumented one-offs.
Chapter Summary#
This chapter covered detection and response infrastructure. It distinguished the types of detection systems and the signature-based and anomaly-based detection methods they use, then explained SIEM and log aggregation as the backbone of centralized monitoring. It introduced user and entity behavior analytics and proactive threat hunting, and mapped adversary behavior with the Cyber Kill Chain and MITRE ATT&CK. The central message is that detection engineering is about turning telemetry into timely, high-confidence alerts and that frameworks like ATT&CK give defenders a shared language for the techniques they must detect and disrupt.
Why This Matters#
An IDS is only as good as its alerting, and alerting is only as good as the analyst who responds. The most sophisticated SIEM is worthless if alerts go unread. Effective detection requires tuned rules, prioritized alerts, trained analysts, and well-practiced response workflows. The measure of a detection capability is not the number of rules deployed but the mean time to detect a real intrusion. World-class programs achieve MTTD measured in hours or days; many organizations discover breaches weeks or months after initial compromise.
News in Focus: Breaches That Were Detectable but Missed#
Post-incident analysis of major breaches has repeatedly shown that the intrusion was detectable much earlier than it was discovered. Indicators including unusual authentication patterns, anomalous data transfers, and new scheduled tasks were present in logs that the organization collected but did not analyze in real time. These findings drive investment in SIEM tuning and SOC staffing: collecting logs is the floor, not the ceiling, of a detection capability.
# Chapter 12 -- Detection metrics: precision, recall, ROC and Snort rule simulator
import matplotlib
matplotlib.use('Agg')
import matplotlib.pyplot as plt
import numpy as np
from io import BytesIO
from IPython.display import display, Image

# ── Precision / Recall metrics ────────────────────────────────────────────────
def metrics(tp, fp, fn):
    precision = tp / (tp + fp) if (tp + fp) > 0 else 0
    recall    = tp / (tp + fn) if (tp + fn) > 0 else 0
    f1        = 2 * precision * recall / (precision + recall) if (precision + recall) > 0 else 0
    fpr       = fp / (fp + (100 - tp - fn)) if (fp + (100 - tp - fn)) > 0 else 0
    return precision, recall, f1, fpr

configs = [
    ("Signature-only (tight)", 40, 5,  60),
    ("Anomaly (loose)",        75, 40, 25),
    ("Tuned SIEM",             68, 12, 32),
    ("ML UEBA",                80, 20, 20),
]

print(f"{'Configuration':<30} {'Precision':>10} {'Recall':>10} {'F1':>8}")
print("-" * 62)
for name, tp, fp, fn in configs:
    p, r, f1, fpr = metrics(tp, fp, fn)
    print(f"{name:<30} {p:>10.2%} {r:>10.2%} {f1:>8.2%}")

# ── Precision-Recall trade-off visualisation ──────────────────────────────────
thresholds = np.linspace(0, 1, 50)
precision_curve = 0.3 + 0.65 * thresholds
recall_curve    = 0.95 - 0.85 * thresholds

fig, axes = plt.subplots(1, 2, figsize=(11, 4))

axes[0].plot(thresholds, precision_curve, label="Precision", color="#3a7ebf", lw=2)
axes[0].plot(thresholds, recall_curve,   label="Recall",    color="#e05a4e", lw=2)
axes[0].axvline(0.55, color="#888", ls="--", lw=1)
axes[0].text(0.57, 0.55, "Balanced\noperating point", fontsize=8, color="#555")
axes[0].set_xlabel("Detection threshold"); axes[0].set_ylabel("Score")
axes[0].set_title("Figure 12.1a  Precision vs Recall Trade-Off"); axes[0].legend()

axes[1].plot(recall_curve, precision_curve, color="#5ba3cc", lw=2)
axes[1].fill_between(recall_curve, precision_curve, alpha=0.15, color="#5ba3cc")
axes[1].scatter([0.75], [0.76], color="#e05a4e", zorder=5, s=80)
axes[1].text(0.55, 0.6, "Area under\ncurve = quality\nof classifier", fontsize=8)
axes[1].set_xlabel("Recall"); axes[1].set_ylabel("Precision")
axes[1].set_title("Figure 12.1b  Precision-Recall Curve")

plt.tight_layout()
_buf = BytesIO()
plt.savefig(_buf, format="png", dpi=120, bbox_inches="tight")
plt.close(); _buf.seek(0)
display(Image(data=_buf.read()))

# ── Simple Snort rule simulator ───────────────────────────────────────────────
print("\n=== Snort Rule Simulator ===")

def snort_match(rule_content, payload):
    return rule_content.lower() in payload.lower()

rules = [
    dict(sid=1001, msg="Possible /etc/passwd access via HTTP", content="/etc/passwd"),
    dict(sid=1002, msg="SQL injection OR 1=1 pattern",        content="OR 1=1"),
    dict(sid=1003, msg="XSS script tag",                     content="<script>"),
    dict(sid=1004, msg="Nmap default scan UA",               content="Nmap Scripting Engine"),
]

payloads = [
    "GET /index.html HTTP/1.1",
    "GET /../../etc/passwd HTTP/1.1",
    "POST /login username=admin'%20OR%201=1%20-- HTTP/1.1",
    "GET /search?q=<script>alert(1)</script> HTTP/1.1",
    "GET /page HTTP/1.1\r\nUser-Agent: Nmap Scripting Engine",
]

for payload in payloads:
    matched = [r for r in rules if snort_match(r["content"], payload)]
    status = f"ALERT: {', '.join(r['msg'] for r in matched)}" if matched else "NO MATCH"
    print(f"  {payload[:55]!r:<57} -> {status}")
Configuration                   Precision     Recall       F1
--------------------------------------------------------------
Signature-only (tight)             88.89%     40.00%   55.17%
Anomaly (loose)                    65.22%     75.00%   69.77%
Tuned SIEM                         85.00%     68.00%   75.56%
ML UEBA                            80.00%     80.00%   80.00%
=== Snort Rule Simulator ===
  'GET /index.html HTTP/1.1'                                -> NO MATCH
  'GET /../../etc/passwd HTTP/1.1'                          -> ALERT: Possible /etc/passwd access via HTTP
  "POST /login username=admin'%20OR%201=1%20-- HTTP/1.1"    -> NO MATCH
  'GET /search?q=<script>alert(1)</script> HTTP/1.1'        -> ALERT: XSS script tag
  'GET /page HTTP/1.1\r\nUser-Agent: Nmap Scripting Engine' -> ALERT: Nmap default scan UA
Review Questions (MCQ)#
Q1. The difference between IDS and IPS is primarily that IPS: A. Uses only signature detection B. Is placed inline and can actively block traffic C. Only monitors host activity D. Requires a SIEM
Q2. A false negative in intrusion detection means: A. An alert fired on benign traffic B. A real attack that did not trigger an alert C. An alert with low confidence D. An outdated signature
Q3. Signature detection is limited by: A. Being too slow B. Inability to detect zero-day attacks without a matching signature C. High false-positive rate D. Not working on encrypted traffic
Q4. In a Snort rule, the content keyword matches:
A. A regex pattern B. A byte sequence in the packet payload C. The source IP address D. The destination port
Q5. Anomaly detection requires: A. A pre-defined signature database B. An established baseline of normal behavior C. Inline traffic inspection D. A RADIUS server
Q6. Which metric measures the fraction of real attacks that triggered an alert? A. Precision B. Specificity C. Recall D. False positive rate
Q7. A SIEM detects complex attacks by: A. Running antivirus on endpoints B. Correlating events across multiple log sources C. Blocking traffic at the firewall D. Performing vulnerability scanning
Q8. UEBA is most effective against: A. Known malware families B. Zero-day exploits C. Insider threats and compromised accounts whose credentials are valid D. DDoS attacks
Q9. Threat hunting differs from traditional alerting in that it: A. Uses automated rules B. Is reactive to alerts C. Is proactive and hypothesis-driven D. Requires no analyst expertise
Q10. Alert fatigue is caused by: A. Too few analysts B. Too many untuned, noisy alerts overwhelming analysts C. Encrypted traffic D. Missing network taps
Answers: Q1 B, Q2 B, Q3 B, Q4 B, Q5 B, Q6 C, Q7 B, Q8 C, Q9 C, Q10 B.
Lab Assignment#
Part A – Snort rule writing: Write five Snort rules targeting: a Telnet banner grab, a password spray attempt (5 failed logins in 10 seconds), a request for /.git/config, an SQL injection UNION SELECT pattern, and a directory traversal ../ sequence. Test each rule against a simulated payload using the simulator above.
Part B – Precision/recall analysis: Given TP=85, FP=30, FN=15 for a detection configuration, compute precision, recall, and F1. Then adjust the threshold to achieve F1 > 0.85. What trade-off does this require?
Part C – SIEM correlation rule: Write a multi-step SIEM correlation rule (in pseudocode or any rule language) that detects the following pattern: failed login to an account, followed within 10 minutes by a successful login from a different IP, followed within 30 minutes by access to a sensitive file share. Explain what adversary behavior this targets.
Part D – Threat hunt: Design a threat hunt hypothesis for “an attacker has deployed a scheduled task for persistence after compromising a service account.” Specify: the data sources, the specific queries, the key indicators, and what a positive finding looks like.
References#
Practical Computer Security (Course 3): Detection and Mitigation of Threats and Attacks – lectures on Intrusion Detection, Intrusion Prevention, and Detection Methods.
Hutchins, E., Cloppert, M., and Amin, R. (2011). Intelligence-Driven Computer Network Defense (the Cyber Kill Chain). Lockheed Martin.
MITRE ATT&CK knowledge base. https://attack.mitre.org/ ; Sigma detection rules. https://sigmahq.io/
Kent, K., and Souppaya, M. (2006). Guide to Computer Security Log Management. NIST Special Publication 800-92. https://doi.org/10.6028/NIST.SP.800-92