Chapter 5: Risk Management#
“Risk management is the identification, assessment, and prioritization of risks followed by the coordinated and economical application of resources to minimize, monitor, and control the probability or impact of unfortunate events.” – a working definition widely used in the profession
The previous four chapters surveyed threats, from broken ciphers to deceived employees. No organization can defend against all of them at once, with unlimited budget and perfect coverage. Risk management is the discipline that decides what to defend, how much to spend, and what to accept, turning the open-ended catalog of threats into a prioritized, economically rational program. It is, in a real sense, the management layer that sits above every technical control in this book, and it is tested heavily across the CISSP, CISA, and CGRC certifications.
Learning Objectives#
After completing this chapter, you will be able to:
Define risk and its components, asset, threat, vulnerability, likelihood, and impact, and relate them.
Describe the risk-management lifecycle: identify, assess, treat, and monitor.
Perform qualitative risk assessment using likelihood and impact and a risk matrix.
Perform quantitative risk assessment using asset value (AV), exposure factor (EF), single loss expectancy (SLE), annualized rate of occurrence (ARO), annualized loss expectancy (ALE), and return on security investment (ROSI).
Select among the risk-treatment options: avoid, mitigate, transfer, and accept, and explain residual risk, risk appetite, and risk tolerance.
Apply threat-modeling methods such as STRIDE and attack trees.
Compare the major risk frameworks: the NIST Risk Management Framework (RMF), NIST Cybersecurity Framework (CSF) 2.0, ISO/IEC 27005 and 31000, and the FAIR model.
Explain business continuity and disaster recovery concepts, including business impact analysis (BIA), recovery time objective (RTO), and recovery point objective (RPO).
Key Terms#
Risk: the likelihood that a threat exploits a vulnerability, combined with the resulting impact.
Asset: anything of value to the organization that warrants protection.
Threat: any agent or circumstance that could cause harm to an asset.
Vulnerability: a weakness that a threat can exploit.
Likelihood: the probability that a given threat exploits a given vulnerability.
Impact: the magnitude of harm if the risk is realized.
Inherent risk: risk before controls; residual risk: risk remaining after controls.
Risk appetite: the amount of risk an organization is willing to pursue; risk tolerance: the acceptable variation around it.
ALE (Annualized Loss Expectancy): expected yearly loss from a risk, SLE multiplied by ARO.
RMF (Risk Management Framework): NIST’s structured process for managing information-system risk.
BIA (Business Impact Analysis): analysis identifying critical functions and the impact of their disruption.
RTO / RPO (Recovery Time / Point Objective): maximum tolerable downtime / data loss.
5.1 Risk as the Organizing Principle of Security#
Chapter 1 introduced risk informally as probability times impact; this chapter develops it into the central management discipline of the field. The reason risk management matters is the same reason security is hard: resources are finite, threats are unlimited, and perfect security is impossible. Spending must therefore be allocated where it does the most good, which requires a defensible way to compare unlike dangers, a ransomware outbreak against a stolen laptop against a regulatory fine, on a common scale. Risk management provides that scale and the process for acting on it.
A useful framing, drawn directly from professional practice, is that security is always a balance among security, functionality, and usability: pushing hard toward one diminishes the others. A system locked down to the point of being unusable provides no value, while one optimized purely for convenience invites compromise. Finding the right balance requires knowing the organization’s goals, understanding what security means in that context, and being able to measure the threats. Risk management is the structured way to strike and continually re-strike that balance as the organization, the technology, and the threat landscape change.
Two further ideas frame the chapter. First, risk management is continuous, not a one-time project, because assets, threats, and controls all change. Second, it operates at multiple levels: the technical risk of a single system, the operational risk of a business process, and the strategic, enterprise risk that boards and executives must own. Mature programs connect these levels, so that a vulnerability in a server can be traced up to its business consequence and a board’s risk appetite can be traced down to concrete control decisions. We begin with the vocabulary that makes such reasoning precise.
It is also worth distinguishing risk management from two adjacent ideas it is often confused with. Threat management focuses on the adversaries and their techniques; it is an input to risk management but narrower, since risk also weighs accidental and environmental dangers and, crucially, impact and appetite. Compliance management ensures mandated controls are in place; as Section 5.17 stresses, it is a floor rather than the whole structure. Risk management is the superset that integrates threats, vulnerabilities, impacts, business priorities, and legal obligations into a single prioritized program, which is precisely why it sits at the management layer above the technical disciplines and why senior leadership, not the IT department alone, must own it.
5.2 The Vocabulary of Risk#
Precise terms are the prerequisite for measuring anything, so we sharpen the definitions Chapter 1 introduced. Risk is the probability that a threat will successfully exploit a vulnerability, together with the resulting impact. It is built from three basic elements. An asset is any item of value, a database, a server, a reputation, a business process, owned by the organization. A threat is any agent, condition, or circumstance that could cause harm, loss, or compromise to an asset; from a security perspective, threats are categorized by which property of the CIA triad they endanger. A vulnerability is a weakness in design, implementation, code, or process, or the absence of a needed control, that a threat can exploit. The exploit, though not strictly a component of risk, is the tool or technique by which a threat acts on a vulnerability.
From these, two further quantities give risk its shape. Likelihood is the probability that a particular threat exploits a particular vulnerability, influenced by the threat’s capability and motivation and by the presence or absence of countermeasures. Impact is the magnitude of harm if the risk is realized, which may be measured in lost lives, dollars, reputation, market share, or disrupted operations, and is commonly graded as high (serious loss or business interruption), medium (a short pause or moderate loss), or low (mild damage with no interruption of critical processes). The core relationship, which every risk method elaborates, is that risk is a function of likelihood and impact: a severe consequence that is highly likely is a top priority, while a trivial consequence that is unlikely can often be accepted.
Two refinements complete the vocabulary. Inherent risk is the risk present before any controls are applied; residual risk is what remains after controls, and it is the residual risk that an organization must consciously accept or further treat. Risk appetite expresses how much risk an organization is willing to take in pursuit of its objectives, and risk tolerance the acceptable variation around that level. These concepts turn risk from a vague worry into something an organization can state, measure, and govern, which is the subject of the lifecycle that follows.
It helps to expand the threat side of this vocabulary, because “threat” is often used loosely. A threat source (or threat agent) is the actor or force behind a threat, while a threat event is the specific action it might take, and a threat vector is the path it uses. The adversarial threat sources of Chapter 1, from script kiddies to advanced persistent threats, are only one category; risk assessment must also weigh accidental threats (a misconfiguration, a mistyped command), structural threats (hardware and software failure, exhausted resources), and environmental threats (fire, flood, extended power loss). Each category endangers one or more properties of the CIA triad, and a complete risk register considers all of them rather than fixating on hackers alone, since in practice human error and equipment failure cause a large share of incidents.
Likelihood and impact also deserve more precise treatment than a single label. Likelihood is shaped by the threat source’s capability and motivation, the ease of exploiting the vulnerability, and, critically, the presence or absence of controls, which is why the same vulnerability carries different likelihood in different environments. Impact is multidimensional: a single incident can cause financial loss, operational disruption, legal and regulatory penalties, reputational harm, and, in safety-critical systems, physical danger or loss of life. Mature assessments therefore rate impact across several dimensions rather than collapsing it to one number too early, and they distinguish single impact from aggregate impact when one event cascades across many systems, the lesson of supply-chain incidents.
5.3 The Risk-Management Lifecycle#
Having defined risk, we need a repeatable process for managing it, because a one-time assessment ages the moment it is finished. Although frameworks differ in their labels, virtually all describe the same cycle, which the EC-Council, for example, renders as risk identification, assessment, treatment, tracking, and review. We will use four core stages: identify, assess, treat, and monitor.
Identify establishes what could go wrong: cataloging assets and their value, the threats that face them, and the vulnerabilities through which those threats could act. Assess analyzes the identified risks to determine their likelihood and impact, qualitatively, quantitatively, or both, and ranks them so that attention flows to what matters most. Treat chooses and implements a response for each significant risk, avoiding, mitigating, transferring, or accepting it, and records the residual risk that remains. Monitor (and review) tracks the treated risks and the environment over time, verifying that controls remain effective and re-running the cycle as assets, threats, and the business change.
        graph LR
    A[Identify - assets, threats, vulnerabilities] --> B[Assess - likelihood x impact, prioritize]
    B --> C[Treat - avoid / mitigate / transfer / accept]
    C --> D[Monitor & Review - track residual risk, re-evaluate]
    D --> A
The loop is deliberate: risk management never ends, because the conditions it manages never stop changing. The remaining sections follow this lifecycle in order, beginning with identification, then the two assessment methods, then treatment, and then the frameworks and specialized areas, business continuity and supply-chain risk, that apply the same cycle to particular problems.
A subtle but important point is that the lifecycle operates at multiple, nested scopes simultaneously. At the system level, a single application is assessed and authorized. At the mission or business-process level, the risk to a whole service (say, online banking) is managed across the many systems that support it. At the organizational (enterprise) level, leadership manages the aggregate risk to the institution and sets the appetite that constrains the lower levels. NIST captures this as a three-tier model, and the practical consequence is that information must flow both ways: risk decisions at the top set direction for the systems below, while real risk data from systems must roll up to inform leadership. A program that assesses individual systems but never aggregates, or that sets enterprise appetite but never connects it to concrete control decisions, has a broken lifecycle even if each piece looks healthy.
5.4 Risk Identification#
The lifecycle begins with identification, because a risk that is never identified can never be managed, and the most dangerous risks are often the unknown ones. Identification has three intertwined activities: inventorying and valuing assets, enumerating threats, and discovering vulnerabilities.
Asset identification and valuation comes first, because you cannot protect what you do not know you have, and you cannot prioritize without knowing what each asset is worth. An asset inventory spans hardware, software, data, people, facilities, and intangibles such as reputation and intellectual property. Valuation may be quantitative (a replacement cost or revenue contribution in dollars) or qualitative (a criticality rating), and it should reflect not just the asset’s direct value but the consequences of its loss, the stolen laptop whose real value is the unreleased product plans it holds.
Threat identification asks what could harm each asset. Threat sources are commonly grouped as adversarial (the threat actors of Chapter 1, from script kiddies to nation-states), accidental (human error), structural (equipment and software failure), and environmental (fire, flood, power loss). Cataloging threats is aided by threat intelligence, historical incident data, and structured threat modeling, discussed in Section 5.8. Vulnerability identification asks where each asset is weak, drawing on vulnerability scanning and penetration testing (Chapters 6 through 10), configuration reviews, audits, and the absence of needed controls. The product of this stage is a risk register: a living catalog that pairs assets with the threats and vulnerabilities that endanger them, ready for the assessment stage to score and rank. The quality of everything that follows depends on the completeness of this identification, which is why mature programs invest heavily in asset management and continuous discovery.
Asset and Data Classification#
Because not all assets are equally valuable, identification is incomplete without classification, the process of grouping assets, especially data, by sensitivity so that protection can be proportionate. Classification answers a question every later control depends on: how much protection does this deserve? Governments and businesses use parallel schemes. The U.S. government classification system, oriented to confidentiality, runs Unclassified (disclosure causes no damage), Confidential (disclosure could cause damage), Secret (disclosure could cause serious damage), and Top Secret (disclosure could cause exceptionally grave or catastrophic damage). The typical commercial classification scheme runs Public (no harm from release), Sensitive (some harm), Private (personal information such as employee or medical records), and Confidential (the most sensitive, such as trade secrets whose release should be prevented at all costs).
Classification drives handling requirements, the labeling, storage, transmission, access, retention, and destruction rules appropriate to each level, so that confidential data is encrypted, access-controlled, and securely destroyed while public data is not over-protected. It also assigns responsibility through defined roles: the data owner (typically a senior business leader) is accountable for classifying data and approving access; the data custodian (often IT) implements and maintains the controls; the data steward ensures data quality and appropriate use; and users handle data according to policy. Getting classification right is foundational, because every downstream decision, which controls to apply, which risks to prioritize, which regulations apply, depends on knowing what each asset is worth and how sensitive it is.
A Worked Risk Register#
The output of identification and assessment is best captured in a risk register, a living table that makes risks explicit, comparable, and assignable. A simplified extract might look like the following.
ID |
Asset |
Threat |
Vulnerability |
Likelihood |
Impact |
Inherent risk |
Treatment |
Owner |
Residual |
|---|---|---|---|---|---|---|---|---|---|
R1 |
Customer database |
Ransomware |
Unpatched server, no offline backup |
High |
High |
Critical |
Mitigate (patch, immutable backups) |
IT Director |
Medium |
R2 |
Employee laptops |
Theft |
No full-disk encryption |
Medium |
High |
High |
Mitigate (enforce encryption) |
IT Ops |
Low |
R3 |
Public website |
DDoS |
Single hosting provider |
Medium |
Medium |
Medium |
Transfer (CDN/scrubbing) |
Web Lead |
Low |
R4 |
Payroll process |
Insider fraud |
No separation of duties |
Low |
High |
Medium |
Mitigate (dual control) |
Finance |
Low |
R5 |
Legacy app |
Exploit of EOL software |
Vendor no longer patches |
Medium |
Medium |
Medium |
Accept (documented) + compensating isolation |
CISO |
Medium |
Each row pairs an asset with the threat and vulnerability that endanger it, scores the risk before and after treatment, names a treatment and an accountable owner, and records the residual risk that remains. The register is reviewed regularly, with new risks added, treated risks re-scored, and accepted risks revisited at their review dates. This single artifact operationalizes the entire lifecycle: it is where identification, assessment, treatment, ownership, and monitoring come together, and it is what an auditor or executive asks to see first.
5.5 Qualitative Risk Assessment#
Once risks are identified, they must be assessed so that limited resources flow to the most important ones, and the faster, more flexible of the two assessment methods is the qualitative approach. Qualitative assessment rates risk in relative terms, typically high, medium, and low, rather than in precise figures. It is essentially structured, educated judgment, and its strengths are speed, flexibility, and the ability to incorporate intangible factors such as reputation that resist a dollar figure. Its weakness is subjectivity: two analysts may rate the same risk differently.
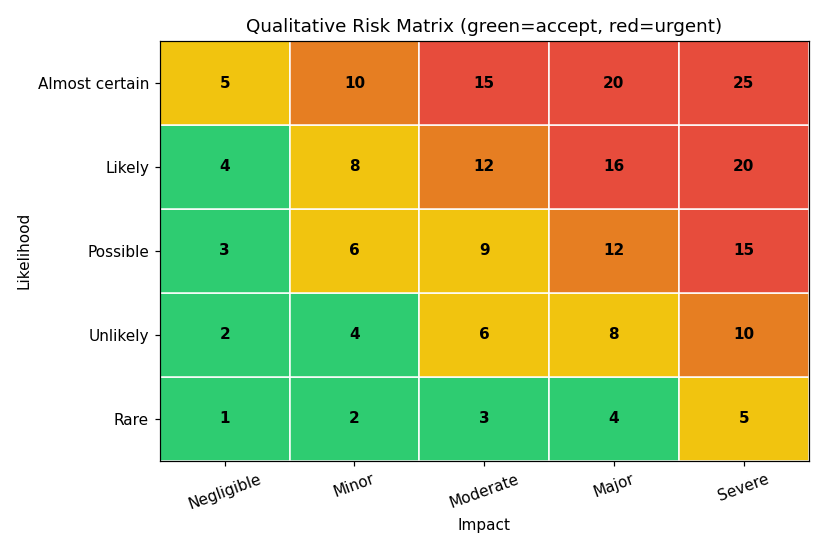
The mechanics are simple and rest on the core relationship that risk equals likelihood times impact. Each risk is assigned a likelihood level (for example high, medium, or low, perhaps mapped to rough probabilities) and an impact level (high meaning serious loss or business interruption, medium a moderate or short-lived disruption, low mild damage). Combining the two on a risk matrix (also called a heat map) yields a priority: a risk that is both highly likely and high impact lands in the red zone and demands immediate attention, while a low-likelihood, low-impact risk lands in the green zone and may be accepted. The matrix is valuable precisely because it communicates priorities visually to non-technical decision-makers, turning a long list of risks into an at-a-glance picture. The code cell renders a representative five-by-five risk matrix.
# Chapter 5 -- A 5x5 qualitative risk matrix (likelihood x impact)
import matplotlib
matplotlib.use("Agg")
import matplotlib.pyplot as plt
import numpy as np

likelihood = ["Rare","Unlikely","Possible","Likely","Almost certain"]
impact     = ["Negligible","Minor","Moderate","Major","Severe"]
# score = (row index +1) * (col index +1); higher = worse
grid = np.array([[(r+1)*(c+1) for c in range(5)] for r in range(5)])

fig, ax = plt.subplots(figsize=(7.5, 5))
# color by score band
colors = np.empty(grid.shape, dtype=object)
for r in range(5):
    for c in range(5):
        s = grid[r, c]
        colors[r, c] = "#2ecc71" if s <= 4 else "#f1c40f" if s <= 9 else "#e67e22" if s <= 14 else "#e74c3c"
for r in range(5):
    for c in range(5):
        ax.add_patch(plt.Rectangle((c, r), 1, 1, facecolor=colors[r, c], edgecolor="white"))
        ax.text(c+0.5, r+0.5, str(grid[r, c]), ha="center", va="center", fontweight="bold")
ax.set_xticks(np.arange(5)+0.5); ax.set_xticklabels(impact, rotation=20)
ax.set_yticks(np.arange(5)+0.5); ax.set_yticklabels(likelihood)
ax.set_xlim(0,5); ax.set_ylim(0,5)
ax.set_xlabel("Impact"); ax.set_ylabel("Likelihood")
ax.set_title("Qualitative Risk Matrix (green=accept, red=urgent)")
plt.tight_layout(); plt.savefig("ch05_risk_matrix.png", dpi=110)
print("Saved ch05_risk_matrix.png  (score = likelihood rank x impact rank)")
Knowledge Check
On a risk matrix, where does a risk that is “almost certain” but “negligible” in impact fall, and how should it generally be treated?
Why might an organization prefer qualitative assessment for a brand-new type of risk with no historical data?
Answers: (1) High likelihood but low impact lands in a low-to-moderate (often yellow/green) zone; such risks are typically accepted or addressed with low-cost controls, not treated as emergencies. (2) Qualitative assessment relies on expert judgment and does not require the historical frequency and loss data that quantitative methods need, so it works when reliable numbers do not yet exist.
5.6 Quantitative Risk Assessment#
Where qualitative assessment ranks risks in relative terms, quantitative assessment expresses them in money, which is the language executives use to allocate budget, so the two methods are complementary and often combined. The classic model, introduced in Chapter 1 and developed here, builds from a small chain of defined quantities.
The asset value (AV) is the worth of the asset. The exposure factor (EF) is the percentage of that value lost in a single incident; for a stolen laptop holding unencrypted personal data, the exposure factor is 100 percent, because the device and all its data are gone. Their product is the single loss expectancy (SLE), the money lost from one occurrence: SLE equals AV times EF. The annualized rate of occurrence (ARO) estimates how many times per year the event is expected, and multiplying gives the annualized loss expectancy (ALE): ALE equals SLE times ARO. The ALE is the pivotal figure, because it states an expected yearly cost that can be compared directly against the annual cost of a control. When a safeguard reduces the ALE by more than it costs to run, it is justified, a comparison captured by the return on security investment (ROSI). The code cell works a complete example, and the In-Class Exercise that follows lets students compute their own.
Quantitative analysis also underpins the cost-benefit logic of choosing safeguards. The value a control provides in a year can be estimated as the reduction in annualized loss expectancy it achieves: (ALE before the control) minus (ALE after the control). A control is financially justified when that reduction exceeds the control’s annual cost, which must be reckoned as total cost of ownership, not just purchase price: licensing, implementation, maintenance, training, and the productivity overhead the control imposes all count. Comparing the ALE reduction against total cost across candidate controls lets an organization rank investments and spend where each dollar buys the most risk reduction, the quantitative expression of the ROSI introduced above. The method’s honest limitation is the quality of its inputs: exposure factors and especially annualized rates of occurrence are often educated guesses, so prudent analysts use ranges and sensitivity analysis rather than false-precision point estimates, and they treat the numbers as a structured aid to judgment rather than a substitute for it.
Going Deeper (graduate/research): from point ALE to probabilistic risk
The classical ALE formula collapses an uncertain future into a single expected value, which can badly mislead, because two risks with the same ALE can have very different distributions: one a frequent small loss, the other a rare catastrophic one. Modern quantitative risk analysis, exemplified by the FAIR model, instead represents each input (loss event frequency, loss magnitude, and their sub-factors such as threat event frequency and vulnerability) as a probability distribution, then uses Monte Carlo simulation to produce a distribution of annual loss. From that distribution one reads not just the mean (the point ALE) but tail measures such as the 95th- or 99th-percentile loss, the “bad year” that drives decisions about insurance limits and catastrophic-risk controls. This shift, from a single number to a distribution with explicit uncertainty, mirrors how mature engineering and finance treat risk, and it is increasingly expected of senior security risk practitioners. The code cell in this section gives a minimal illustration; production tools formalize the input distributions and calibrate them with expert estimation techniques.
# Chapter 5 -- Quantitative risk: SLE, ARO, ALE, and a control's ROSI
def assess(asset_value, exposure_factor, aro):
    sle = asset_value * exposure_factor
    ale = sle * aro
    return sle, ale

# Example from a typical exam-style question
AV, EF, ARO = 100_000, 0.25, 3
SLE, ALE = assess(AV, EF, ARO)
print(f"Asset value (AV)         : ${AV:,.0f}")
print(f"Exposure factor (EF)     : {EF:.0%}")
print(f"Single loss expectancy   : ${SLE:,.0f}   (AV x EF)")
print(f"Annual rate (ARO)        : {ARO}")
print(f"Annualized loss expect.  : ${ALE:,.0f}   (SLE x ARO)\n")

# Evaluate a proposed control that cuts ARO from 3 to 0.5 and costs $30,000/yr
new_ARO = 0.5
control_cost = 30_000
_, ALE_after = assess(AV, EF, new_ARO)
benefit = ALE - ALE_after
rosi = (benefit - control_cost) / control_cost * 100
print(f"ALE after control        : ${ALE_after:,.0f}")
print(f"Annual benefit           : ${benefit:,.0f}")
print(f"Control cost             : ${control_cost:,.0f}")
print(f"ROSI                     : {rosi:.0f}%  -> {'JUSTIFIED' if rosi>0 else 'NOT justified'}")
Asset value (AV)         : $100,000
Exposure factor (EF)     : 25%
Single loss expectancy   : $25,000   (AV x EF)
Annual rate (ARO)        : 3
Annualized loss expect.  : $75,000   (SLE x ARO)

ALE after control        : $12,500
Annual benefit           : $62,500
Control cost             : $30,000
ROSI                     : 108%  -> JUSTIFIED
In-Class Exercise: run a quantitative assessment
Individually or in pairs, pick one asset from your own life or a fictional company (for example a laptop, a customer database, or an e-commerce server). Estimate its asset value, assign an exposure factor for a specific threat (theft, ransomware, hardware failure), and estimate the annualized rate of occurrence. Compute the SLE and ALE. Then propose one control, estimate its annual cost and its effect on the exposure factor or rate of occurrence, and compute the ROSI to decide whether the control is justified. Compare results across the class and discuss why estimates of ARO and EF vary so widely, and what that implies about relying on quantitative figures alone.
5.7 Risk Treatment#
Assessment tells us which risks matter; treatment decides what to do about them, which is where risk management becomes action. For every significant risk, an organization chooses among four classic responses, and the art lies in matching the response to the risk’s likelihood, impact, and cost to address.
Risk avoidance eliminates the risk by not engaging in the activity that creates it, declining to collect sensitive data the organization does not need, or discontinuing a risky product line. Avoidance removes the risk entirely but also forgoes whatever benefit the activity offered, so it suits risks whose potential harm outweighs their value. Risk mitigation (reduction) applies controls to lower the likelihood or impact to an acceptable level; this is the most common response and encompasses nearly every technical and administrative control in this book. Risk transfer (sharing) shifts the financial consequence to a third party, most commonly through cyber-insurance, or by outsourcing a function to a provider contractually responsible for it; transfer addresses the impact but not the underlying likelihood, and it never transfers reputational harm or, usually, legal accountability. Risk acceptance consciously decides to bear a risk, appropriate when the cost of treatment exceeds the expected loss or when the residual risk falls within the organization’s risk appetite; crucially, acceptance must be a documented, authorized decision, not mere inaction.
Two ideas govern these choices. First, no treatment reduces risk to zero, so what remains after controls is residual risk, which must be explicitly accepted by an appropriate authority, the formal sign-off that the authorization step of the NIST RMF (Section 5.9) makes concrete. Second, treatment decisions are bounded by the organization’s risk appetite and tolerance: a risk within appetite may simply be accepted, while one beyond tolerance must be avoided, mitigated, or transferred until it fits. Good risk treatment is therefore not about eliminating risk but about deliberately, and accountably, choosing which risks to keep.
Each treatment option carries nuances worth drawing out. Mitigation is rarely all-or-nothing; controls reduce likelihood (preventive controls such as patching and access control), reduce impact (detective and corrective controls such as monitoring and backups), or both, and a portfolio of overlapping controls (defense in depth) usually beats a single strong one. Transfer through cyber-insurance has grown complex: policies increasingly exclude certain causes, require demonstrated security controls (such as multi-factor authentication) as a condition of coverage, and cap payouts, so insurance complements rather than replaces technical controls, and it never transfers the reputational damage or, generally, the legal duty to protect data. Avoidance can be the right call for activities whose risk dwarfs their benefit, but it has an opportunity cost and can simply push risk elsewhere. Acceptance must be explicit, time-bound, and authorized at a level commensurate with the risk, with a date to revisit it; quietly tolerating a known risk because addressing it is inconvenient is not acceptance but negligence.
A further subtlety is that treatments interact and can create secondary risk (a new risk introduced by a control, such as a backup system that itself becomes a target) and leave residual risk that must be re-assessed after treatment, not assumed away. The cost-benefit logic also has limits: a control should not cost more than the expected loss it prevents, but some risks (those threatening safety or legal compliance) must be treated regardless of a narrow dollar calculation. Skilled risk treatment, then, is a portfolio decision made under uncertainty and within a stated risk appetite, not a mechanical lookup.
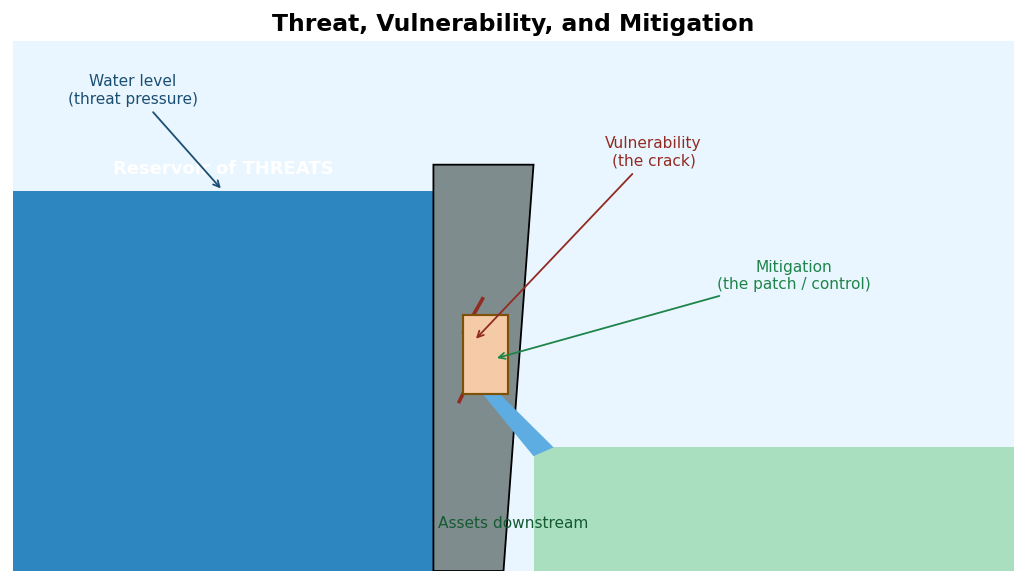
The mitigation step can be pictured with the dam metaphor from Chapter 1: the reservoir of threats presses on the defenses, a crack is the vulnerability, and the control is the patch that holds the water back.
A short numerical exercise shows how a single control reduces risk. Suppose the annualized loss expectancy from a data breach is 2,000,000 US dollars, and the probability that a breach succeeds is 0.40 when data is left unencrypted but only 0.08 when it is encrypted. The expected annual loss is then 0.40 x 2,000,000 = 800,000 dollars without encryption and 0.08 x 2,000,000 = 160,000 dollars with it, so encryption reduces expected loss by 800,000 - 160,000 = 640,000 dollars per year. If encryption costs less than that to deploy and operate, it is, by the ROSI logic above, clearly justified, a concrete illustration of risk mitigation paying for itself.
5.8 Threat Modeling#
Risk identification and assessment become far more rigorous when they are driven by a structured way of imagining how a system could be attacked, which is the purpose of threat modeling. Threat modeling is an engineering technique for systematically identifying threats, attacks, vulnerabilities, and countermeasures that could affect a system, ideally performed early and repeatedly during design rather than bolted on afterward. A common five-step formulation is to define security requirements, create a diagram of the application and its data flows, identify threats, mitigate them, and validate that the mitigations work; the EC-Council renders the phases as identifying security objectives, building an application overview, decomposing the application, identifying threats, and identifying vulnerabilities.
Several methodologies structure the threat-identification step. STRIDE, developed at Microsoft, is a mnemonic for six threat categories: Spoofing (impersonation, countered by authentication), Tampering (unauthorized modification, countered by integrity controls), Repudiation (denying an action, countered by non-repudiation and logging), Information disclosure (countered by confidentiality), Denial of service (countered by availability controls), and Elevation of privilege (countered by authorization). Walking a data-flow diagram and asking which STRIDE threats apply to each element is a powerful, repeatable habit. Other approaches include DREAD (a rating scheme: Damage, Reproducibility, Exploitability, Affected users, Discoverability), PASTA (the Process for Attack Simulation and Threat Analysis, a risk-centric seven-stage method), and attack trees, which decompose an attacker’s goal into the sub-goals and steps needed to achieve it.
        graph TD
    G[Attacker goal: steal customer data] --> A[Compromise web app]
    G --> B[Compromise database directly]
    G --> C[Phish an administrator]
    A --> A1[SQL injection]
    A --> A2[Exploit unpatched component]
    B --> B1[Exposed port / weak credentials]
    C --> C1[Spear-phishing email]
    C --> C2[Vishing the help desk]
The attack tree above shows how a single objective branches into multiple paths, each of which threat modeling then assesses and mitigates. Threat modeling is itself an element of risk management: it feeds the identification and assessment stages with a disciplined, attacker’s-eye inventory of what could go wrong, ensuring the risk register reflects realistic attack paths rather than a generic checklist.
Applying STRIDE element by element makes it concrete: for a web application’s login data flow, spoofing is countered by strong authentication, tampering by TLS and input validation, repudiation by audit logging, information disclosure by encryption and least privilege, denial of service by rate limiting, and elevation of privilege by careful authorization checks. Walking each component of a data-flow diagram and asking “which of the six could happen here, and what stops it?” converts vague worry into a checklist of concrete, testable mitigations. DREAD, though now less favored because its ratings are subjective, illustrates how teams prioritize discovered threats by scoring Damage, Reproducibility, Exploitability, Affected users, and Discoverability and summing the result.
Beyond these design-time methods, the MITRE ATT&CK knowledge base has become the dominant way to reason about real-world attacker behavior. ATT&CK catalogs the tactics (the attacker’s goals, such as initial access, persistence, privilege escalation, lateral movement, and exfiltration) and the specific techniques used to achieve each, all drawn from observed campaigns. Defenders use ATT&CK to map their detection coverage, to threat-model against the techniques most relevant to their industry, and to communicate precisely about adversary behavior, complementing the design-oriented STRIDE with an operations-oriented, empirically grounded view. Together, design-time threat modeling and ATT&CK-based analysis ensure the risk register reflects both how a system could be attacked in theory and how adversaries actually operate in practice.
Several further methodologies round out the practitioner’s toolkit, and the choice depends on the goal. LINDDUN is the privacy counterpart to STRIDE, with seven categories (Linkability, Identifiability, Non-repudiation, Detectability, Disclosure of information, Unawareness, and Non-compliance) for finding privacy threats. OCTAVE (Operationally Critical Threat, Asset, and Vulnerability Evaluation) takes an organizational, mission-level view rather than a purely technical one. Trike is an audit-focused, risk-based method. The hybrid Threat Modeling Method (hTMM) and the Security Cards brainstorming approach come from Carnegie Mellon’s Software Engineering Institute, and the Quantitative Threat Modeling Method combines attack trees with STRIDE and DREAD to produce numeric estimates. These modeling methods should be distinguished from scoring systems: the Common Vulnerability Scoring System (CVSS) rates the severity of a known vulnerability but does not by itself model how a system can be attacked. STRIDE itself was introduced in 1999 by Loren Kohnfelder and Praerit Garg at Microsoft and remains the most common starting point.
5.9 Risk Frameworks and Standards#
Organizations rarely invent risk processes from scratch; they adopt established frameworks that encode good practice, provide a common language, and satisfy auditors and regulators. Because the certifications this book targets test these frameworks directly, we survey the most important, noting that deeper governance treatment appears in Chapter 19.
The NIST Risk Management Framework (RMF), defined in NIST Special Publication 800-37, gives U.S. federal systems (and many others) a seven-step lifecycle: Prepare, Categorize the system and its data, Select controls, Implement them, Assess their effectiveness, Authorize the system to operate (the formal acceptance of residual risk by a senior official), and Monitor continuously. It is supported by NIST SP 800-30 (conducting risk assessments) and SP 800-39 (organization-wide risk management), and it is the backbone of the CGRC certification, whose practice areas map almost one-to-one onto the RMF steps. The NIST Cybersecurity Framework (CSF) 2.0, updated in 2024, organizes activity into six functions, Govern, Identify, Protect, Detect, Respond, and Recover, and is widely used across sectors as a flexible, outcome-based way to assess and communicate cybersecurity posture.
International standards play the same role globally. ISO/IEC 27005 provides guidance specifically on information-security risk management within the broader ISO/IEC 27001 Information Security Management System (ISMS), against which organizations seek accredited certification, while ISO 31000 offers generic, enterprise-wide risk-management principles applicable beyond information technology. For organizations that want rigorous quantitative risk analysis, the FAIR (Factor Analysis of Information Risk) model decomposes risk into measurable factors, loss event frequency and loss magnitude and their sub-components, to produce defensible, probabilistic loss estimates rather than simple high-medium-low ratings. Related governance and control frameworks, COBIT for IT governance, and control catalogs such as NIST SP 800-53 and the CIS Critical Security Controls, connect risk decisions to specific safeguards. The practical point is not to memorize every framework but to recognize that they all implement the same identify-assess-treat-monitor lifecycle, differing mainly in scope, sector, and rigor, so an organization chooses the one that fits its regulatory context and maturity.
The NIST RMF Steps in Detail#
Because the CGRC certification is organized around it, the seven RMF steps deserve elaboration. In Prepare, the organization establishes context, roles, a risk-management strategy, and a risk assessment at the organizational level. In Categorize, the system and the information it processes are classified by the potential impact (low, moderate, or high) to confidentiality, integrity, and availability, following the FIPS 199 impact levels; this categorization drives everything that follows. In Select, an appropriate baseline of controls (from NIST SP 800-53) is chosen for that impact level and tailored to the system. In Implement, the controls are deployed and documented. In Assess, an independent assessor tests whether the controls are implemented correctly and operating as intended. In Authorize, a senior official, the authorizing official, reviews the residual risk and makes an explicit, accountable decision to grant (or deny) an authorization to operate, the formal risk-acceptance act. In Monitor, the system and its controls are watched continuously, with changes triggering reassessment. This cycle institutionalizes the identify-assess-treat-monitor lifecycle inside a repeatable, auditable government process.
CSF Tiers and Profiles, and ISO 27001#
The NIST Cybersecurity Framework adds two practical constructs beyond its six functions. Implementation Tiers (from Tier 1, Partial, to Tier 4, Adaptive) describe how rigorous and integrated an organization’s risk practices are, helping it gauge maturity. Profiles capture the organization’s current and target states across the framework’s outcomes, so the gap between them becomes a prioritized roadmap. On the international side, ISO/IEC 27001 specifies the requirements for an Information Security Management System (ISMS), a management-system approach in which security is planned, implemented, checked, and improved continuously; its companion Annex A enumerates a catalog of control objectives and controls spanning organizational, people, physical, and technological domains. Organizations pursue accredited ISO 27001 certification to demonstrate, to customers and regulators, that their security management meets an international bar. Governance-oriented frameworks complete the picture: COSO provides an enterprise-risk and internal-control framework often used for financial controls, and COBIT maps IT governance objectives to business needs, both of which connect technical risk to board-level oversight, the subject of Chapter 19.
The table summarizes the major frameworks and where each fits, so a practitioner can choose by context rather than habit.
Framework |
Origin / scope |
Best used for |
Notes |
|---|---|---|---|
NIST RMF (SP 800-37) |
US government, system-level |
Authorizing systems to operate |
7 steps; basis of CGRC; pairs with SP 800-53 controls |
NIST CSF 2.0 |
US, any sector, program-level |
Assessing and communicating posture |
6 functions; Tiers and Profiles for maturity and roadmap |
ISO/IEC 27001 + 27005 |
International |
Certifiable security management (ISMS) + risk method |
Annex A control catalog; third-party certification |
ISO 31000 |
International, enterprise-wide |
Generic risk management beyond IT |
Principles and process, not IT-specific |
FAIR |
Industry (quantitative) |
Defensible dollar/probabilistic risk estimates |
Decomposes risk into measurable factors |
COSO / COBIT |
Enterprise governance |
Internal control and IT governance |
Connect technical risk to board oversight |
NIST SP 800-53 / CIS Controls |
US / community |
Selecting and prioritizing controls |
Catalogs and baselines, not risk processes themselves |
The essential insight, repeated because it cuts through the alphabet soup, is that these frameworks are complementary lenses on the same lifecycle: a single organization might use ISO 27001 to certify its management system, the CSF to communicate posture to its board, FAIR to quantify its largest risks, and the CIS Controls to select safeguards, all without contradiction.
5.10 The Security Program: Policies, Standards, and Controls#
Frameworks describe what to do; a security program is how an organization actually does it, translating risk decisions into durable rules and controls. A security program provides the big picture for keeping data secure, defining what is covered, assessing the risks faced, describing how they will be mitigated, and stating how often the program is re-evaluated. It is built from a hierarchy of governing documents whose distinctions are tested on certification exams. Policies state what management requires (for example, “all sensitive data must be encrypted”). Standards specify mandatory choices that implement policy (for example, “use AES-256”). Procedures give step-by-step instructions to accomplish a task. Baselines define a minimum acceptable configuration used as a point of comparison. Guidelines offer recommended, non-mandatory advice. Together these move from high-level intent down to concrete, repeatable action, and a gap at any level, a policy with no procedure, a standard with no baseline, undermines the whole.
The controls a program selects to mitigate risk are the safeguards introduced in Chapter 1, classified by type (administrative, technical, physical) and by function (preventive, detective, corrective, deterrent, compensating, directive). Control selection is itself risk-driven: rather than applying every possible control, the program chooses those that reduce the most significant risks cost-effectively, often starting from a catalog such as NIST SP 800-53 or the CIS Controls and tailoring it to the organization. The program then implements, trains staff on, and audits these controls, the audit step, periodic review of whether controls exist and are effective, being mandated by regulations such as the Health Insurance Portability and Accountability Act (HIPAA). The result is a managed cycle: assess risk, set policy, implement controls, train people, and audit, which is simply the risk lifecycle expressed as an ongoing organizational program. Governance of this program, the roles, oversight, and culture that sustain it, is the subject of Chapter 19.
Control Catalogs and Foundational Control Principles#
Selecting controls is easier when drawing on established catalogs. NIST SP 800-53 organizes hundreds of controls into families (such as Access Control, Audit and Accountability, Configuration Management, Incident Response, and System and Communications Protection), and provides impact-based baselines to start from. The CIS Critical Security Controls offer a prioritized, prescriptive set of safeguards ordered roughly by impact, which is especially useful for organizations seeking a concrete starting point rather than an exhaustive catalog. Whatever the source, control selection is risk-driven and tailored, not a blind application of everything available.
Several foundational principles shape how controls are designed and combined, and they recur throughout the certifications. Least privilege grants each user and process only the access it needs. Separation of duties divides a sensitive task so no single person can complete it alone, preventing both fraud and single points of failure; its enforcement partner, dual control, requires two people to act together. Job rotation moves people through roles to deter and detect wrongdoing and to reduce dependence on any individual, and mandatory vacation serves a similar detective purpose in sensitive roles. Need to know limits access to the specific information required for a task even among those with sufficient clearance. These administrative principles, layered with the technical and physical controls of Chapter 1, are how a security program turns policy into resilient, abuse-resistant operations, and they are tested heavily because they reflect timeless organizational wisdom rather than any particular technology.
Knowledge Check
A control reduces a risk’s ALE from \(200,000 to \)40,000 and costs $50,000 per year to operate. Is it financially justified, and what is its ROSI?
Why is separation of duties considered both a fraud-prevention and an error-reduction control?
Answers: (1) Yes; the annual benefit is \(160,000 against a \)50,000 cost, so ROSI is (160,000 - 50,000) / 50,000 = 220 percent. (2) Because requiring two people to complete a sensitive action means a single person can neither commit fraud unilaterally nor have a single mistake go unchecked, since the second person reviews or co-authorizes the action.
5.11 Business Continuity and Disaster Recovery#
Some risks cannot be fully prevented, fires, floods, major outages, and ransomware among them, so risk management must also plan for resilience: keeping the organization running through disruption and recovering afterward. This is the domain of business continuity and disaster recovery, a heavily tested area across CISSP and CISA. The foundation is the business impact analysis (BIA), which identifies the organization’s critical functions, the resources they depend on, and the consequences, financial, operational, legal, and reputational, of their disruption over time. The BIA tells the organization what must be recovered first and how quickly, turning resilience from a guess into a prioritized plan.
The BIA produces several key metrics. The recovery time objective (RTO) is the maximum tolerable duration a function can be down before unacceptable harm occurs, and it drives how fast recovery capabilities must be. The recovery point objective (RPO) is the maximum tolerable amount of data loss measured in time, and it drives how frequently data must be backed up; an RPO of one hour means backups no more than an hour apart. The maximum tolerable downtime (MTD) bounds the total outage a function can survive. Two related operational metrics from Chapter 4, mean time between failures and mean time to repair, feed these calculations.
These metrics shape the plans. A business continuity plan (BCP) keeps essential functions operating during a disruption, while a disaster recovery plan (DRP) restores IT systems and data afterward. Recovery strategies trade cost against speed: backups (full, incremental, and differential, with differing restore times), and alternate sites ranging from a cold site (space and power only, cheap but slow) through a warm site (partially equipped) to a hot site (fully equipped and nearly instantaneous, but expensive). Crucially, plans must be tested through walkthroughs, tabletop exercises, and full simulations, because an untested plan routinely fails when first used. Business continuity connects directly to incident response (Chapter 14) and digital forensics (Chapter 13), which handle the acute phase of a disruptive event.
Resilience Engineering: Backups, Redundancy, and Plan Testing#
The recovery strategies a continuity plan relies on deserve more detail, because their design directly determines whether RTO and RPO can actually be met. Backups come in three common forms: a full backup copies everything and restores fastest but is slowest to create; an incremental backup copies only what changed since the last backup of any kind, making it fast to create but slow to restore (each increment must be applied in order); and a differential backup copies everything changed since the last full backup, a middle ground that is faster to restore than incrementals. Backups should follow the widely cited 3-2-1 principle, three copies, on two types of media, with one off-site, and increasingly an immutable or offline copy to survive ransomware that seeks out and encrypts backups. Redundancy builds resilience into systems directly: RAID (redundant array of independent disks) tolerates disk failure, clustering and load balancing tolerate server failure, and geographically separated data centers tolerate site failure, supporting high availability measured in “nines” of uptime.
The most important and most neglected practice is testing the plan. Tests range from a checklist or read-through review, through a tabletop exercise in which the team talks through a scenario, to a simulation or parallel test that exercises recovery systems without disrupting production, up to a full interruption test that actually fails over to recovery infrastructure. Each level offers more assurance at more cost and risk, and organizations climb the ladder as their plans mature. The recurring lesson, echoed in the incident-response chapter, is that an untested plan is a hypothesis, not a capability, and disasters are a poor time to discover that backups never restored or that the failover site was misconfigured.
It is worth distinguishing the related plans that an organization maintains, because exam questions and real programs both rely on the distinctions. The business continuity plan (BCP) is the umbrella focused on keeping the whole organization functioning. The disaster recovery plan (DRP) is the IT-focused subset that restores systems and data. A continuity of operations plan (COOP) is the term used in government for sustaining essential functions. An incident response plan (Chapter 14) handles the immediate detection and containment of an event, and a crisis communication plan governs how the organization communicates with employees, customers, regulators, and the public during a disruption. These plans interlock: an incident may trigger the incident-response plan, which, if the disruption is severe enough, escalates to the disaster-recovery and business-continuity plans, all while the crisis-communication plan manages stakeholders. Designing them as a coherent family, rather than disconnected documents, and testing them together, is what separates organizations that recover quickly from those that improvise under pressure.
5.12 Third-Party and Supply-Chain Risk#
An organization’s risk does not stop at its own boundary, because modern operations depend on a web of vendors, cloud providers, software libraries, and contractors, each of which can become a path to compromise. Third-party risk management (TPRM) and the broader supply-chain risk management (SCRM) extend the risk lifecycle to these external dependencies, and recent history has made them urgent: as Chapter 1 discussed, the SolarWinds compromise reached thousands of victims through a single trusted software update, and attacks on widely used open-source components have rippled across the internet.
Managing this risk involves assessing vendors before engagement (security questionnaires, audits, certifications such as SOC 2 or ISO 27001), embedding security requirements and the right to audit into contracts, monitoring vendors over time rather than once, and planning for a vendor’s failure or breach. For software specifically, practices such as maintaining a software bill of materials (SBOM), the list of components and dependencies in a product, verifying the integrity and provenance of updates, and securing the build pipeline address the supply-chain attack vector directly. The governing principle is that you can outsource a function but not the accountability for its risk: when a provider is breached, the organization that entrusted them with data still bears the regulatory, legal, and reputational consequences. Supply-chain risk therefore belongs squarely within enterprise risk management, not at its margins.
Case study: the 2022 LastPass breach. The compromise of the password manager LastPass shows how third-party and credential exposure compound. In a first incident disclosed on August 25, 2022, an attacker used access to a developer’s account to steal source code and technical information from the development environment, and the company initially reported that no customer data was taken. Using information from that first intrusion, the attacker then targeted a senior engineer (reportedly through a vulnerability on the engineer’s home computer) to reach credentials for LastPass’s cloud storage and exfiltrated backups of customer data. By the December 22, 2022 disclosure, the stolen data included customer account metadata (company and end-user names, billing addresses, email and IP addresses, and telephone numbers) and, critically, copies of customer password vaults. Because LastPass used a zero-knowledge design, the most sensitive vault fields remained encrypted under each user’s master password, which LastPass never stores, so the attacker did not obtain master passwords directly. The lesson is not that encryption failed but that an offline copy of the vaults let attackers brute-force weak master passwords at leisure, and later investigations linked the breach to real-world theft from victims whose master passwords or key-derivation settings were weak. It illustrates several themes of this chapter at once: the blast radius of a single compromised developer, the value of metadata even when payloads are encrypted, and why master-password and key-derivation strength belong in the risk calculus.
5.13 Assurance Evaluation#
A final, more specialized question is how much an organization should trust a product’s security claims, which is the domain of assurance evaluation. An assurance evaluation examines the security-relevant parts of a system, its trusted computing base, access-control mechanisms, reference monitor, and security kernel (Chapter 1), to determine the level of protection it provides. Historically, the U.S. Department of Defense’s Trusted Computer System Evaluation Criteria (TCSEC), the “Orange Book” of the Rainbow Series, graded systems from D (minimal) up to A1 (verified design), focusing on confidentiality and introducing the trusted-computing-base concept. Today the internationally recognized standard is the Common Criteria (ISO/IEC 15408), which superseded TCSEC and its European counterpart ITSEC. Under the Common Criteria, protection profiles define security requirements for a category of products, vendors build a target of evaluation against a security target, and accredited laboratories evaluate the result, assigning an Evaluation Assurance Level. Such evaluations are most often required for products sold to governments, and they give buyers a standardized basis for comparing security claims, one more way that risk management imports rigor into decisions that would otherwise rest on vendor assertion.
Cloud computing deserves specific mention as a third-party risk, because most organizations now run critical workloads on infrastructure they do not own. The governing concept is the shared responsibility model: the cloud provider secures the underlying infrastructure (“security of the cloud”) while the customer remains responsible for how they configure and use it (“security in the cloud”), including identity and access management, data classification and encryption, and correct configuration. A large share of real cloud incidents stem not from provider failures but from customer misconfiguration, such as storage buckets left publicly readable, which is precisely a risk-management and governance failure rather than a provider one. Effective cloud risk management therefore requires understanding exactly where the responsibility boundary falls for each service model (infrastructure, platform, or software as a service), continuously monitoring configuration against secure baselines, and recognizing that moving to the cloud transfers some operational burden but never transfers accountability for the data.
5.14 Security Roles, Responsibilities, and Accountability#
Risk cannot be managed without clear ownership, so a mature program defines who is responsible for what, which is where risk management meets organizational structure. At the top, the board of directors and senior executives own enterprise risk and set the risk appetite, increasingly treating cybersecurity as a governance matter rather than a purely technical one. The chief information security officer (CISO) typically leads the security program, translating business risk into a security strategy and reporting posture upward. Senior (information) risk owners accept residual risk for systems within their purview, the authorizing-official role formalized in the RMF.
Below this, the data-handling roles introduced in Section 5.4, data owner, custodian, steward, and user, assign day-to-day responsibility for protecting information, while system owners are accountable for specific systems and control owners for specific safeguards. Clear assignment matters because diffuse responsibility is how risks fall through the cracks: a vulnerability that is “everyone’s problem” is no one’s problem. Many organizations use a responsibility-assignment matrix (commonly RACI: Responsible, Accountable, Consulted, Informed) to make ownership unambiguous for each risk and control. A critical principle, repeated for emphasis, is that accountability cannot be delegated or outsourced: a manager may assign the work of implementing a control, but remains accountable for the outcome, and an organization may outsource a function but remains accountable to regulators and customers for the risk. This clarity of ownership is what allows the rest of the lifecycle, identification, assessment, treatment, and monitoring, to actually happen rather than remaining a document on a shelf.
5.15 Measuring Risk: Metrics, KPIs, and KRIs#
A program that cannot be measured cannot be improved or defended to leadership, so mature risk management relies on metrics. Two categories matter. Key performance indicators (KPIs) measure how well the security program is operating, for example the percentage of systems patched within policy, the mean time to detect and respond to incidents, the coverage of multi-factor authentication, or security-awareness phishing-simulation results. Key risk indicators (KRIs) are forward-looking signals that risk is rising, for example a growing backlog of unpatched critical vulnerabilities, an increase in failed login attempts, or expanding use of unmanaged devices; a KRI crossing a threshold prompts action before a risk is realized.
Good metrics share several traits: they are tied to business objectives and risk appetite, measured consistently over time so trends are visible, and actionable rather than merely interesting. They feed risk reporting tailored to the audience, technical dashboards for operations, concise risk summaries expressed in business and financial terms for executives and the board. The discipline of measurement closes the lifecycle’s monitoring stage: it reveals whether treatments are working, whether residual risk is drifting outside tolerance, and where to invest next. It also guards against a common failure mode in which a program is busy but ineffective; without metrics, activity is mistaken for security. Connecting metrics to the quantitative methods of Section 5.6, and to frameworks’ continuous-monitoring requirements, turns risk management from a periodic exercise into a living, data-informed practice.
5.16 Managing Risk Across the System Lifecycle#
Risk is cheapest to address early, so leading organizations embed it throughout the system development lifecycle rather than assessing security only at the end. In the requirements phase, security and privacy requirements are defined alongside functional ones. In design, threat modeling (Section 5.8) identifies risks while changes are still inexpensive. In implementation, secure-coding standards and developer training reduce the introduction of vulnerabilities, and automated tools, static application security testing (SAST) on source code and software composition analysis on third-party components, catch flaws as code is written. In testing, dynamic application security testing (DAST) and penetration testing (Chapters 6 through 10) probe the running system. In deployment and operations, configuration management, vulnerability management, and continuous monitoring keep risk in check, and in decommissioning, secure data destruction prevents residual data from becoming a liability.
This “shift-left” philosophy, moving security earlier in the lifecycle, is reinforced by modern DevSecOps practice, which integrates security checks into the continuous integration and delivery pipeline so that risk is assessed automatically and continuously rather than as a one-time gate. The economic argument is compelling and well established: a flaw caught in design costs a fraction of the same flaw fixed in production after a breach. Managing risk across the lifecycle therefore connects this chapter to the software-security material of Chapter 10 and the operational disciplines of Chapters 11 through 14, and it embodies the chapter’s central theme, that risk is managed continuously and proactively, not discovered reactively after harm has occurred.
5.17 Compliance as a Risk Driver#
For many organizations, legal and regulatory obligations are among the largest drivers of risk decisions, because non-compliance carries fines, liability, and reputational harm independent of any technical breach. A risk manager must therefore know which regimes apply and what they demand; the details of privacy and law are developed in Chapter 18, but their role as risk drivers belongs here. Major regimes include the Sarbanes-Oxley Act (SOX), which governs the integrity of financial reporting and its supporting IT controls; the Gramm-Leach-Bliley Act (GLBA), governing financial-institution handling of customer data; the Health Insurance Portability and Accountability Act (HIPAA), setting standards for protected health information and mandating, for example, annual security evaluation; the Payment Card Industry Data Security Standard (PCI DSS), a contractual standard for organizations handling payment cards; the General Data Protection Regulation (GDPR) in the European Union, with significant fines for mishandling personal data; the Family Educational Rights and Privacy Act (FERPA) for student records; and the Children’s Internet Protection Act (CIPA).
Compliance and risk management are related but not identical, a distinction worth stressing. Compliance is necessary but not sufficient: meeting a checklist of mandated controls does not guarantee an organization is actually secure, and a compliance-only mindset can produce “paper” security that satisfies auditors while leaving real risks untreated. Conversely, a strong risk-based program will usually satisfy most compliance requirements as a byproduct, because the regulations encode broadly sensible controls. The mature posture treats compliance as a floor, a mandatory baseline whose obligations feed the risk register as requirements that must be met, while continuing to manage the residual and emerging risks that no regulation anticipates. This is also why audits (Chapter 19) matter: they verify that required controls exist and function, providing assurance to regulators, customers, and the organization’s own leadership that the program is real and not merely documented.
5.18 Insider Risk and Human Factors#
Much of risk management implicitly assumes the threat comes from outside, but some of the most damaging risks originate within the trust boundary, which is why insider risk warrants its own treatment. As Chapter 1 noted, insiders divide into the malicious (a disgruntled or bribed employee, a departing worker stealing data) and the negligent (a careless click, a misconfiguration, a lost device), and a third category, the compromised insider whose legitimate credentials an external attacker has stolen, blurs the boundary entirely. Insider risk is uniquely hard to manage because insiders begin with authorized access, knowledge of where valuable assets sit, and an understanding of existing controls, which lets them bypass perimeter defenses that stop outsiders.
Managing insider risk draws on controls already introduced but applied with this threat in mind: least privilege and need-to-know limit what any insider can reach; separation of duties and dual control prevent a single insider from completing a sensitive action alone; job rotation and mandatory vacation create opportunities to detect wrongdoing; thorough logging and user-behavior analytics surface anomalous access; and robust hiring (background checks) and termination procedures (immediate access revocation) bound the window of exposure. Equally important are the human factors that drive negligent insider risk, workload, poor usability of secure procedures, and weak security culture, which connect risk management to the human element of Chapter 4 and the governance and culture of Chapter 19. The balance is delicate: monitoring must be proportionate and respect privacy and employee trust, since heavy-handed surveillance can itself erode the culture that keeps people honest. Insider risk thus exemplifies the chapter’s theme that risk is managed through a blend of technical, administrative, and human controls, never technology alone.
5.19 Emerging Risks: AI, Quantum, and the Expanding Attack Surface#
Risk management is forward-looking by nature, so a mature program tracks risks that are still emerging, because the cheapest time to address a risk is before it is fully realized. Three current shifts illustrate the point and recur throughout this book. First, artificial intelligence is a double-edged risk: it strengthens defense (faster detection, as the IBM data shows) but also empowers attackers (better phishing, deepfakes, accelerated vulnerability discovery) and introduces wholly new risks in the AI systems organizations themselves deploy, such as data poisoning, model theft, and prompt injection, along with the “security debt” of governing AI more slowly than it is adopted. Second, the quantum threat discussed in Chapter 2 is a textbook example of a low-likelihood-today, high-impact-tomorrow risk that demands action now: adversaries may already be harvesting encrypted data to decrypt once quantum computers mature, which makes migrating long-lived secrets to post-quantum cryptography a present risk decision, not a future one. Third, the attack surface keeps expanding, through cloud, mobile, the Internet of Things, operational technology, and complex software supply chains, faster than many organizations can inventory and govern it.
The common thread is that risk management must be anticipatory and continuous. New technologies should enter the risk register as they are adopted, not after they cause an incident; horizon scanning for emerging threats and re-assessment triggered by significant change are explicit parts of the monitoring stage. This is also why frameworks emphasize continuous monitoring and why governance (Chapter 19) must keep pace, ensuring that as the organization adopts AI, cloud, and connected devices, the risk lifecycle extends to cover them. The organization that treats risk management as a living, forward-looking discipline, rather than a periodic compliance ritual, is the one prepared for the threats that do not yet have names.
5.20 Bringing It Together: An End-to-End Risk Scenario#
To see the whole lifecycle in motion, consider a mid-size online retailer, “NorthStar,” and follow one risk from identification to monitoring. In the identify stage, NorthStar inventories its assets and flags its customer database, holding names, addresses, and payment-card data, as a crown-jewel asset, classifying it as confidential under its commercial scheme and assigning the head of engineering as data owner. Threat identification, informed by MITRE ATT&CK and recent industry reporting, highlights ransomware and payment-data theft as leading threats, and a vulnerability scan reveals an internet-facing server running an unpatched component with no offline backup.
In the assess stage, NorthStar rates the ransomware risk qualitatively as high likelihood and high impact, landing it in the red zone of the risk matrix, then runs a quantitative estimate: with an asset value driven by breach-response costs, regulatory exposure under PCI DSS, and lost revenue, it estimates a single loss expectancy of 2 million dollars and, given current exposure, an annualized rate of occurrence of 0.5, for an ALE of 1 million dollars. In the treat stage, leadership compares options against the firm’s risk appetite, which does not tolerate a seven-figure ALE on a single foreseeable event. It chooses a mitigation portfolio, patching and configuration management, network segmentation, multi-factor authentication, and immutable offline backups, at a total annual cost of 250,000 dollars, projected to cut the rate of occurrence and impact enough to drop the ALE to roughly 150,000 dollars. The ROSI is strongly positive, the treatment is approved, the head of engineering is recorded as the accountable owner, and the residual risk of 150,000 dollars is formally accepted by the chief information security officer and noted for review in six months. NorthStar also transfers part of the residual exposure through a cyber-insurance policy, whose insurer requires the multi-factor authentication and backups as a condition of coverage, neatly illustrating how transfer and mitigation interlock.
In the monitor stage, NorthStar tracks key risk indicators, the count of unpatched critical vulnerabilities, backup-restore test results, and multi-factor-authentication coverage, on a dashboard reviewed monthly, and reassesses the risk whenever the environment changes materially. A year later, an attempted ransomware intrusion is detected early, contained, and recovered from offline backups within the recovery-time objective, with no data loss beyond the recovery-point objective; the realized impact is a fraction of the inherent risk. This single thread shows every concept of the chapter working together, classification, qualitative and quantitative assessment, treatment selection, ownership, residual-risk acceptance, transfer, continuity metrics, and monitoring, and it demonstrates the central claim that disciplined risk management converts unbounded uncertainty into a managed, survivable, and economically rational program.
5.21 Common Pitfalls in Risk Management#
Understanding the lifecycle is not enough; programs fail in recurring, recognizable ways, and naming these pitfalls helps practitioners avoid them. The first is treating risk management as a one-time project rather than a continuous cycle, so that a glossy assessment ages into irrelevance as systems and threats change. The second is the compliance trap: mistaking a satisfied audit checklist for actual security, which produces “paper” controls that exist on paper but not in practice. The third is false precision: presenting quantitative figures, ALEs to the dollar, as if the underlying estimates of frequency and impact were certain, which can mislead decision-makers more than honest ranges would.
Further pitfalls are organizational rather than technical. Diffuse ownership leaves risks unassigned, so that what is everyone’s responsibility becomes no one’s. Risk-register rot sets in when the register is created for an audit and then never updated, treated, or reviewed. Ignoring residual and aggregate risk, accepting many small risks individually without noticing that together they exceed appetite, has caused real catastrophes. Security-usability imbalance drives users to circumvent controls that are too burdensome, quietly reintroducing the very risks the controls were meant to remove. And failure to communicate in business terms leaves leadership unable to make informed decisions, so security is under-resourced until a crisis forces attention. The antidote to all of these is the disciplined, continuous, owned, and business-aligned practice this chapter describes: a living risk register, honest uncertainty, clear accountability, regular review, and reporting that speaks the language of the people who allocate resources. Recognizing the pitfalls is itself a control, because most failed programs did not lack a framework; they lacked the discipline to run it.
5.22 Comparing FAIR, NIST RMF, and ISO/IEC 27005#
This chapter has drawn on several risk frameworks. Because they are often confused, it helps to state plainly what each is for. FAIR (Factor Analysis of Information Risk) is a quantitative model: it decomposes risk into loss-event frequency and loss magnitude and expresses results in monetary terms, which makes it well suited to comparing options and communicating with executives. The NIST Risk Management Framework (RMF, SP 800-37) is a governance and process framework: a seven-step lifecycle (Prepare, Categorize, Select, Implement, Assess, Authorize, Monitor) that drives a system to an authorization decision using the SP 800-53 control catalog. ISO/IEC 27005 is a risk-management process standard that supports an ISO/IEC 27001 information security management system, describing how to establish context and identify, analyze, evaluate, and treat risk without prescribing specific controls or a specific quantitative method.
Framework |
Type |
Primary use |
Output |
|---|---|---|---|
FAIR |
Quantitative risk model |
Estimating and comparing risk in financial terms |
Probable loss expressed in currency |
NIST RMF (SP 800-37) |
Governance and process |
Authorizing systems to operate |
An authorization decision backed by controls |
ISO/IEC 27005 |
Risk-management process |
Running risk management inside an ISO 27001 ISMS |
A treated, documented risk register |
In practice these are complementary rather than competing: an organization can run the RMF or an ISO 27001 ISMS as its process while using FAIR to quantify the most important risks inside that process.
Chapter Summary#
This chapter developed risk management, the discipline that decides what to defend and how much to spend. Risk combines the likelihood that a threat exploits a vulnerability with the impact on an asset, and security is always a balance among security, functionality, and usability. The lifecycle, identify, assess, treat, and monitor, structures the work. Identification inventories and values assets and enumerates threats and vulnerabilities into a risk register. Assessment is qualitative (likelihood and impact on a risk matrix, fast and flexible but subjective) or quantitative (AV, EF, SLE, ARO, ALE, and ROSI in dollars, precise but data-hungry), and the two are often combined. Treatment chooses to avoid, mitigate, transfer, or accept each risk, leaving a documented residual risk bounded by the organization’s risk appetite. Threat modeling (STRIDE, DREAD, PASTA, attack trees) feeds disciplined attack paths into the process. Established frameworks, the NIST RMF and CSF 2.0, ISO/IEC 27005 and 31000, and the quantitative FAIR model, encode good practice, all implementing the same lifecycle. A security program of policies, standards, procedures, baselines, and guidelines turns decisions into durable controls, while business continuity and disaster recovery (BIA, RTO, RPO, MTD, and tested BCP/DRP) plan for resilience, and supply-chain risk management extends the discipline to vendors and software. With risk understood as the organizing principle, the next part of the book turns to offensive security, beginning with the methodology of penetration testing, the disciplined practice of finding the vulnerabilities that feed this very risk process.
Why This Matters#
Risk management is the discipline that makes all the others coherent. Without it, security becomes a scattershot of controls bought in reaction to the latest headline; with it, finite resources flow to the threats that matter most to a specific organization. Every later chapter, the offensive techniques that reveal vulnerabilities, the defensive technologies that mitigate them, the incident response that handles realized risk, ultimately feeds or is justified by the risk process described here. The vocabulary of asset, threat, vulnerability, likelihood, and impact; the lifecycle of identify, assess, treat, and monitor; the choice among avoid, mitigate, transfer, and accept; and the frameworks that standardize all of it are the tools that turn security from a cost center into a managed, defensible business function. This is also why risk management dominates the management-oriented certifications, CISSP, CISA, and CGRC, and why the professional who can speak the language of risk to executives is far more effective than one who can speak only the language of technology.
News in Focus: Repeat Breaches at Neiman Marcus#
Risk is not a one-time event, and the luxury retailer Neiman Marcus illustrates how the same organization can be struck more than once, with payment-card data the recurring prize. In a first incident, disclosed in January 2014, attackers had planted point-of-sale malware that was active from roughly mid-July to late October 2013; about 370,000 customer credit cards were accessed and approximately 9,200 were subsequently used fraudulently, and the company later paid about 1.6 million US dollars to settle resulting litigation. Years later, a second and larger incident, a breach of online accounts that occurred around May 2020 but was not disclosed until September 2021, exposed information for about 4.6 million online customers, including names, contact details, payment-card numbers, gift-card information, usernames, and the answers to security questions; the company engaged the incident-response firm Mandiant and notified law enforcement.
Through this chapter’s lens, the pattern is instructive. The card-data risk was both high likelihood and high impact for a large retailer, placing it in the red zone of any risk matrix, and the quantifiable costs (fraud, settlement, notification, and reputational harm) are exactly the inputs to the ALE and breach-cost reasoning developed above. The recurrence underscores that risk management is continuous: a single remediation does not retire a risk permanently, because attackers, systems, and exposure keep changing, which is why monitoring and re-assessment are part of the lifecycle. The long gap between the 2020 compromise and its 2021 disclosure also connects to the detection-and-response and breach- notification themes of Chapters 12, 14, and 18. (Details per public reporting and company statements.)
Current News: the price of risk (IBM Cost of a Data Breach 2025)
Risk management’s central claim, that breaches carry quantifiable cost worth spending to reduce, is borne out annually by IBM’s Cost of a Data Breach Report. The 2025 edition reported a global average breach cost of about 4.44 million US dollars, down roughly 9 percent from the prior year’s 4.88 million, the first decline in five years, which IBM attributed largely to faster detection and containment aided by artificial-intelligence-driven defenses (mean time to identify and contain fell to around 241 days). The figure masks wide regional variation: the United States average reached a record of about 10.22 million US dollars. The report also cautioned that organizations adopting AI faster than they govern it are accumulating “security debt,” a new source of risk. For the risk manager, these numbers are practical inputs: they inform impact estimates, justify investment in detection and response (which measurably lower cost), and illustrate why risk is expressed in money. As always, such figures come from a specific methodology and should be cited as reported rather than treated as universal constants.
# Chapter 5 -- Monte Carlo view of annualized loss (why single-point ALE can mislead)
import matplotlib
matplotlib.use("Agg")
import matplotlib.pyplot as plt
import random

# Model uncertainty: ARO and loss per event are not fixed but distributions
random.seed(7)
trials = 20000
losses = []
for _ in range(trials):
    # number of events this year ~ Poisson-like via simple model around mean 0.5
    events = sum(1 for _ in range(5) if random.random() < 0.10)
    annual = 0.0
    for _ in range(events):
        # loss per event varies from $50k to $1.2M (triangular-ish)
        annual += random.triangular(50_000, 1_200_000, 300_000)
    losses.append(annual)

mean_loss = sum(losses)/len(losses)
losses_sorted = sorted(losses)
p95 = losses_sorted[int(0.95*trials)]
print(f"Simulated mean annual loss (~ALE): ${mean_loss:,.0f}")
print(f"95th-percentile annual loss      : ${p95:,.0f}  (the 'bad year' a single ALE hides)")

fig, ax = plt.subplots(figsize=(8,4))
ax.hist([l/1000 for l in losses], bins=50, color="#8e44ad")
ax.axvline(mean_loss/1000, color="black", linestyle="--", label=f"mean ~${mean_loss/1000:,.0f}k")
ax.axvline(p95/1000, color="red", linestyle="--", label=f"95th pct ~${p95/1000:,.0f}k")
ax.set_xlabel("Annual loss (thousands USD)"); ax.set_ylabel("Frequency")
ax.set_title("Distribution of annual loss (Monte Carlo) vs single-point ALE")
ax.legend(); plt.tight_layout(); plt.savefig("ch05_montecarlo.png", dpi=110)
print("Saved ch05_montecarlo.png  -- quantitative risk is a distribution, not one number.")
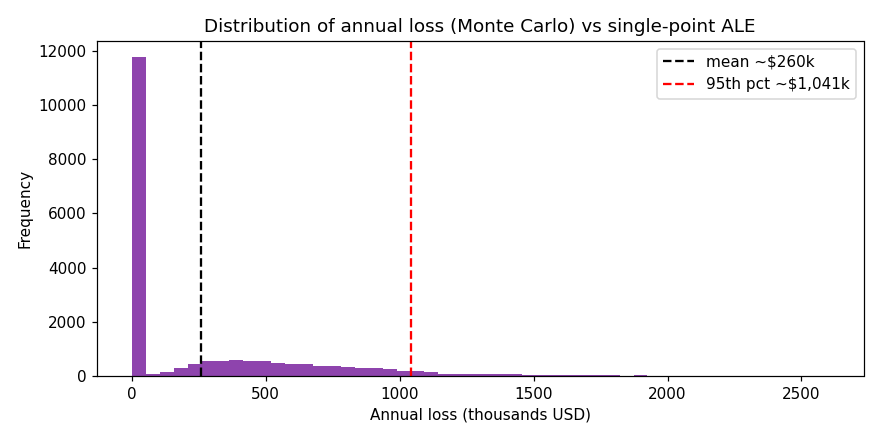
Review Questions (MCQ)#
Q1. Risk is best expressed as a function of: A. Assets and money B. Likelihood and impact C. Threats and exploits D. Controls and policies
Q2. If an asset is valued at \(100,000 and the exposure factor is 25%, the single loss expectancy is: A. \)2,500 B. \(25,000 C. \)75,000 D. $100,000
Q3. Using Q2’s SLE, if the annualized rate of occurrence is 3, the ALE is: A. \(25,000 B. \)50,000 C. \(75,000 D. \)300,000
Q4. Buying cyber-insurance is an example of risk: A. Avoidance B. Mitigation C. Transfer D. Acceptance
Q5. Risk remaining after controls are applied is called: A. Inherent risk B. Residual risk C. Total risk D. Transferred risk
Q6. Which is an advantage of qualitative over quantitative assessment? A. Precise dollar figures B. Speed and ability to include intangibles C. Requires historical data D. Objectivity
Q7. In STRIDE, the “E” stands for: A. Encryption B. Eavesdropping C. Elevation of privilege D. Exposure
Q8. The NIST RMF step in which a senior official formally accepts residual risk is: A. Categorize B. Select C. Authorize D. Monitor
Q9. The recovery point objective (RPO) defines the maximum tolerable: A. Downtime B. Data loss measured in time C. Cost D. Number of incidents
Q10. A hot site, compared to a cold site, is: A. Cheaper and slower B. Fully equipped and fast to activate but expensive C. Only space and power D. Never used
Q11. Which document gives mandatory step-by-step instructions? A. Policy B. Standard C. Procedure D. Guideline
Q12. The FAIR model is primarily used for: A. Network scanning B. Quantitative risk analysis C. Incident response D. Encryption
Q13. Outsourcing a function to a vendor transfers the: A. Accountability for the risk B. Operational task, but not the ultimate accountability C. Reputation D. Legal liability entirely
Q14. A business impact analysis (BIA) primarily determines: A. Which controls to buy B. Critical functions and the impact of their disruption C. The encryption algorithm D. The firewall rules
Q15. The first decline in five years in the global average data-breach cost (IBM 2025) was attributed mainly to: A. Fewer attacks B. Faster detection and containment aided by AI C. Cheaper hardware D. Less data
Answer Key#
1: B 2: B 3: C 4: C 5: B 6: B 7: C 8: C 9: B 10: B 11: C 12: B 13: B 14: B 15: B
Lab Assignment#
Lab 5.1 (beginner) - Build a risk register. For a small organization (real or fictional), list eight assets, and for each identify a threat, a vulnerability, a qualitative likelihood and impact (high/medium/ low), and a proposed treatment (avoid/mitigate/transfer/accept). Plot the risks on a five-by-five matrix and justify your top three priorities.
Lab 5.2 (beginner/intermediate) - Quantitative comparison. Choose two assets and compute SLE, ARO, and ALE for a relevant threat to each. Propose one control per asset, estimate its annual cost and effect, and compute the ROSI. Recommend which control to fund first and explain your reasoning to a hypothetical executive in non-technical terms.
Lab 5.3 (intermediate) - Threat model a system. Draw a data-flow diagram for a simple web application (browser, web server, database). Apply STRIDE to each element and data flow, list the threats found, and propose a mitigation for each. Then build an attack tree for one attacker goal.
Lab 5.4 (advanced/research) - Monte Carlo risk. Extend the Section’s simulation to model a specific risk with your own assumptions about event frequency and loss distribution. Report the mean (point ALE), the 95th-percentile “bad year,” and discuss why communicating a distribution, rather than a single ALE, leads to better risk decisions. Reference the FAIR model in your discussion.
References#
National Institute of Standards and Technology. Risk Management Framework for Information Systems and Organizations, NIST SP 800-37 Rev. 2, 2018.
National Institute of Standards and Technology. Guide for Conducting Risk Assessments, NIST SP 800-30 Rev. 1, 2012.
National Institute of Standards and Technology. Managing Information Security Risk, NIST SP 800-39.
National Institute of Standards and Technology. The NIST Cybersecurity Framework (CSF) 2.0, NIST CSWP 29, 2024.
International Organization for Standardization. ISO/IEC 27005: Information Security Risk Management and ISO 31000: Risk Management Guidelines.
The Open Group / FAIR Institute. Factor Analysis of Information Risk (FAIR).
IBM Security. Cost of a Data Breach Report 2025.
ISO/IEC 15408. Common Criteria for Information Technology Security Evaluation.
Shostack, A. Threat Modeling: Designing for Security. Wiley, 2014.
Related work by the author (see Appendix E):
Despeignes, S., Huggins, T., Trivedi, D. (2025/2026). Local Government Supply Chain Cybersecurity: Addressing the Implementation Gap in Resource-Limited Municipalities, JCSC 41(3). (see Appendix E)
Companion code: municipal-cyber-policy-analytics (analytics on local-government cybersecurity policy and supply-chain risk). See Appendix F.